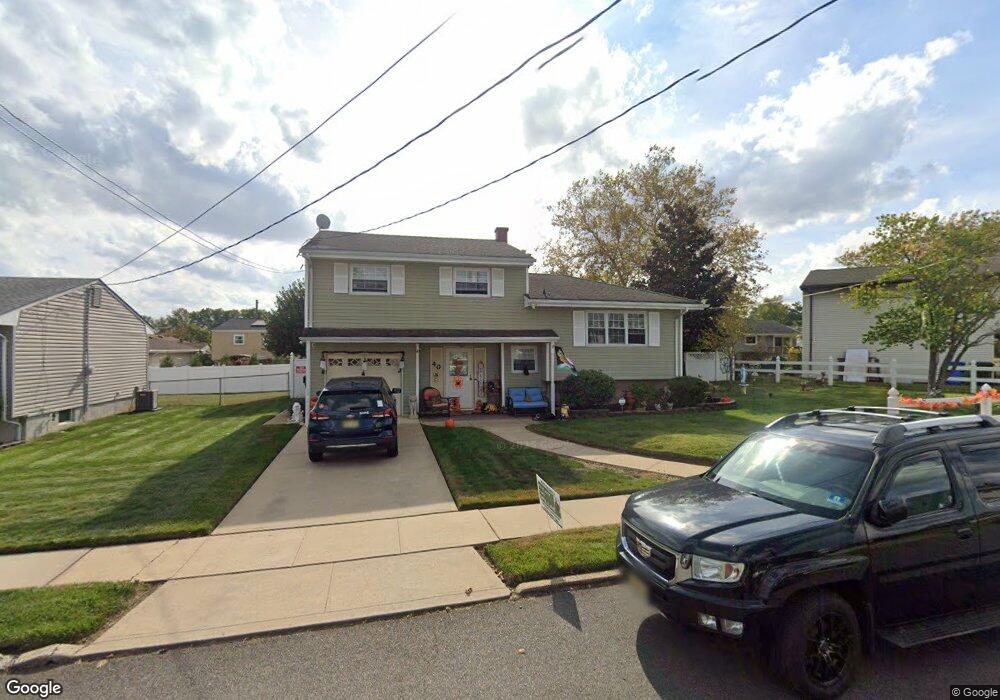
40 Bayberry Ct Port Reading, NJ 07064
Estimated Value: $311,136 - $594,000
--
Bed
--
Bath
1,192
Sq Ft
$425/Sq Ft
Est. Value
About This Home
This home is located at 40 Bayberry Ct, Port Reading, NJ 07064 and is currently estimated at $506,534, approximately $424 per square foot. 40 Bayberry Ct is a home located in Middlesex County with nearby schools including Port Reading Elementary School, Avenel Middle School, and Woodbridge High School.
Ownership History
Date
Name
Owned For
Owner Type
Purchase Details
Closed on
May 15, 2014
Sold by
Ng John P
Bought by
Ng Kevin
Current Estimated Value
Purchase Details
Closed on
Oct 23, 2003
Sold by
Lao Jose M
Bought by
Delibero Vincent and Delibero Diane R
Home Financials for this Owner
Home Financials are based on the most recent Mortgage that was taken out on this home.
Original Mortgage
$125,000
Interest Rate
5.88%
Purchase Details
Closed on
Mar 21, 2001
Sold by
Feranndez Manuel
Bought by
Lao Jose and Lao Maria
Create a Home Valuation Report for This Property
The Home Valuation Report is an in-depth analysis detailing your home's value as well as a comparison with similar homes in the area
Home Values in the Area
Average Home Value in this Area
Purchase History
| Date | Buyer | Sale Price | Title Company |
|---|---|---|---|
| Ng Kevin | -- | None Available | |
| Delibero Vincent | $285,000 | -- | |
| Lao Jose | $160,000 | -- | |
| Lao Jose | $160,000 | -- |
Source: Public Records
Mortgage History
| Date | Status | Borrower | Loan Amount |
|---|---|---|---|
| Previous Owner | Delibero Vincent | $125,000 |
Source: Public Records
Tax History Compared to Growth
Tax History
| Year | Tax Paid | Tax Assessment Tax Assessment Total Assessment is a certain percentage of the fair market value that is determined by local assessors to be the total taxable value of land and additions on the property. | Land | Improvement |
|---|---|---|---|---|
| 2025 | $9,423 | $72,600 | $22,000 | $50,600 |
| 2024 | $9,141 | $72,600 | $22,000 | $50,600 |
| 2023 | $9,141 | $72,600 | $22,000 | $50,600 |
| 2022 | $8,908 | $72,600 | $22,000 | $50,600 |
| 2021 | $8,540 | $72,600 | $22,000 | $50,600 |
| 2020 | $8,496 | $72,600 | $22,000 | $50,600 |
| 2019 | $8,255 | $72,600 | $22,000 | $50,600 |
| 2018 | $8,088 | $72,600 | $22,000 | $50,600 |
| 2017 | $7,925 | $72,600 | $22,000 | $50,600 |
| 2016 | $7,846 | $72,600 | $22,000 | $50,600 |
| 2015 | $7,684 | $72,600 | $22,000 | $50,600 |
| 2014 | $7,486 | $72,600 | $22,000 | $50,600 |
Source: Public Records
Map
Nearby Homes