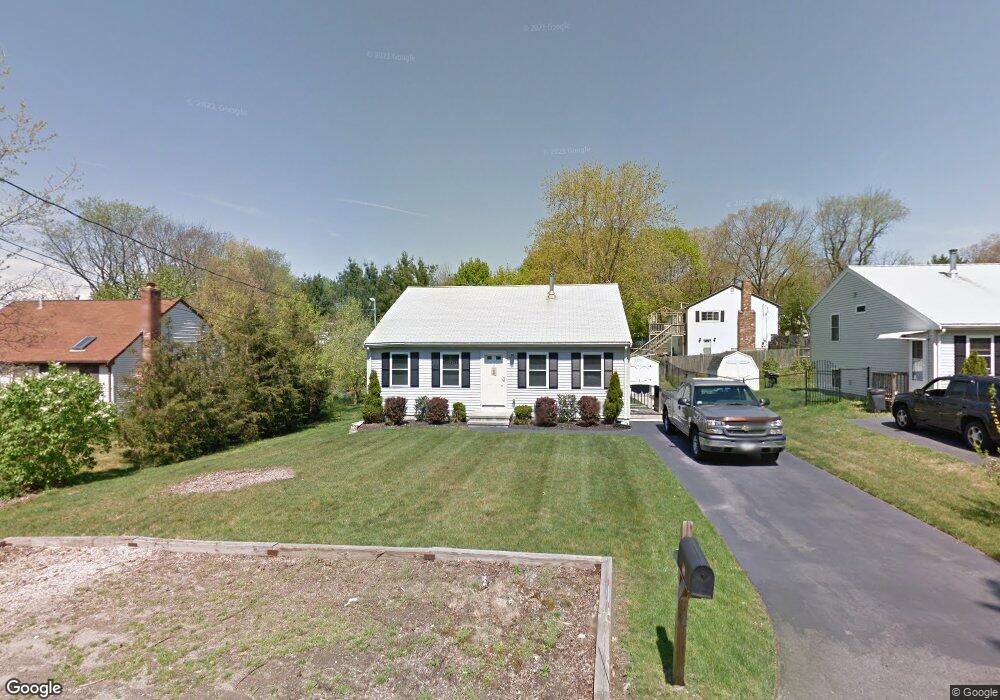
40 Bennett St Brockton, MA 02302
Estimated Value: $465,865 - $518,000
3
Beds
1
Bath
1,272
Sq Ft
$385/Sq Ft
Est. Value
About This Home
This home is located at 40 Bennett St, Brockton, MA 02302 and is currently estimated at $489,966, approximately $385 per square foot. 40 Bennett St is a home located in Plymouth County with nearby schools including Brookfield Elementary School, Mary E. Baker Elementary School, and Downey Elementary School.
Ownership History
Date
Name
Owned For
Owner Type
Purchase Details
Closed on
Jul 14, 2006
Sold by
Rew & Assos Llc
Bought by
Tierney Kevin M
Current Estimated Value
Home Financials for this Owner
Home Financials are based on the most recent Mortgage that was taken out on this home.
Original Mortgage
$228,000
Interest Rate
6.71%
Mortgage Type
Purchase Money Mortgage
Purchase Details
Closed on
Dec 19, 2005
Sold by
Jbr Dev Inc
Bought by
Rew & Assos Llc
Home Financials for this Owner
Home Financials are based on the most recent Mortgage that was taken out on this home.
Original Mortgage
$200,000
Interest Rate
6.34%
Mortgage Type
Purchase Money Mortgage
Purchase Details
Closed on
Dec 1, 2005
Sold by
Ambrose Anthony Allen
Bought by
Jbr Dev Inc
Home Financials for this Owner
Home Financials are based on the most recent Mortgage that was taken out on this home.
Original Mortgage
$200,000
Interest Rate
6.34%
Mortgage Type
Purchase Money Mortgage
Create a Home Valuation Report for This Property
The Home Valuation Report is an in-depth analysis detailing your home's value as well as a comparison with similar homes in the area
Purchase History
| Date | Buyer | Sale Price | Title Company |
|---|---|---|---|
| Tierney Kevin M | $285,000 | -- | |
| Rew & Assos Llc | $266,000 | -- | |
| Jbr Dev Inc | $200,000 | -- |
Source: Public Records
Mortgage History
| Date | Status | Borrower | Loan Amount |
|---|---|---|---|
| Open | Jbr Dev Inc | $212,800 | |
| Closed | Jbr Dev Inc | $228,000 | |
| Closed | Jbr Dev Inc | $42,750 | |
| Previous Owner | Jbr Dev Inc | $200,000 |
Source: Public Records
Tax History
| Year | Tax Paid | Tax Assessment Tax Assessment Total Assessment is a certain percentage of the fair market value that is determined by local assessors to be the total taxable value of land and additions on the property. | Land | Improvement |
|---|---|---|---|---|
| 2025 | $5,129 | $423,500 | $143,900 | $279,600 |
| 2024 | $4,736 | $394,000 | $143,900 | $250,100 |
| 2023 | $4,668 | $359,600 | $108,500 | $251,100 |
| 2022 | $4,454 | $318,800 | $98,500 | $220,300 |
| 2021 | $4,482 | $309,100 | $90,700 | $218,400 |
| 2020 | $4,256 | $280,900 | $87,200 | $193,700 |
| 2019 | $4,112 | $264,600 | $80,500 | $184,100 |
| 2018 | $3,707 | $230,800 | $80,500 | $150,300 |
| 2017 | $3,479 | $216,100 | $80,500 | $135,600 |
| 2016 | $3,515 | $202,500 | $76,700 | $125,800 |
| 2015 | $3,434 | $189,200 | $76,700 | $112,500 |
| 2014 | $3,412 | $188,200 | $76,700 | $111,500 |
Source: Public Records
Map
Nearby Homes
- 44 Bennett St
- 30 Bennett St
- 70 Bennett St
- 35 Bennett St
- 35 Bennett St Unit 1
- 45 Bennett St
- 25 Bennett St
- 285 E Ashland St
- 295 E Ashland St
- 61 Bennett St
- 65 Bennett St
- 277 E Ashland St
- 4 Thomas St
- 75 Bennett St
- 85 Bennett St
- 239 N Cary St
- 239 N Cary St Unit 4
- 239 N Cary St Unit 3
- 239 N Cary St Unit 2
- 239 N Cary St Unit 1
Your Personal Tour Guide
Ask me questions while you tour the home.