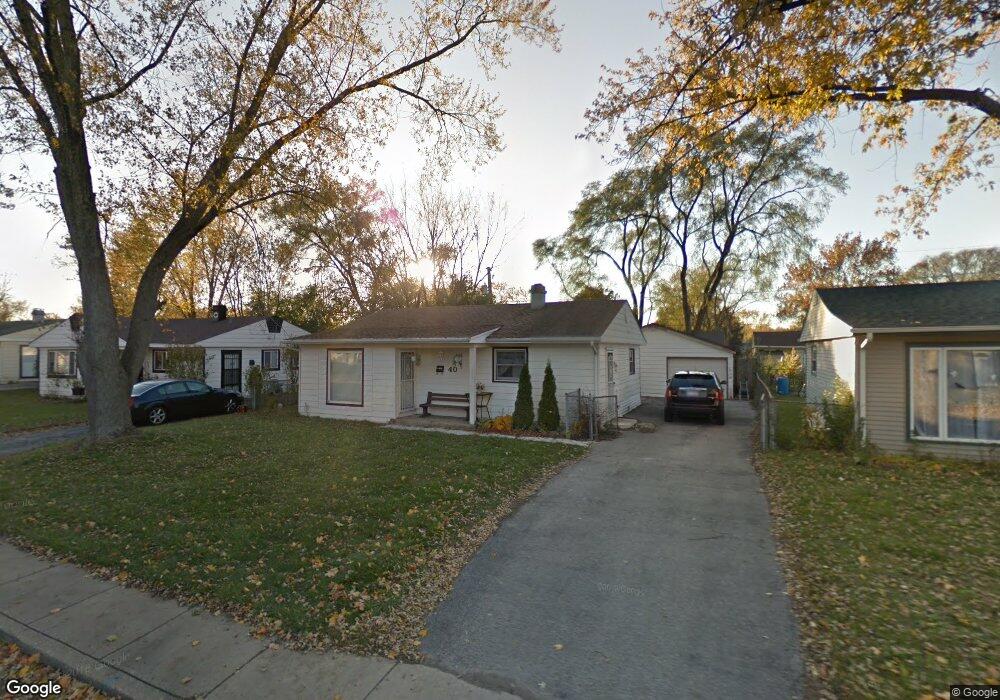
40 Birch St Carpentersville, IL 60110
Estimated Value: $221,000 - $249,585
3
Beds
--
Bath
920
Sq Ft
$254/Sq Ft
Est. Value
About This Home
This home is located at 40 Birch St, Carpentersville, IL 60110 and is currently estimated at $233,896, approximately $254 per square foot. 40 Birch St is a home located in Kane County with nearby schools including Meadowdale Elementary School, Carpentersville Middle School, and Dundee-Crown High School.
Ownership History
Date
Name
Owned For
Owner Type
Purchase Details
Closed on
Jun 19, 2006
Sold by
Perez Carlos
Bought by
Sanchez Jose J and Sanchez Maria
Current Estimated Value
Home Financials for this Owner
Home Financials are based on the most recent Mortgage that was taken out on this home.
Original Mortgage
$16,489
Outstanding Balance
$1,096
Interest Rate
6.73%
Mortgage Type
Stand Alone Second
Estimated Equity
$232,800
Purchase Details
Closed on
Nov 29, 2005
Sold by
Leavy David C and Leavy Carolyn Y
Bought by
Perez Carlos
Home Financials for this Owner
Home Financials are based on the most recent Mortgage that was taken out on this home.
Original Mortgage
$122,400
Interest Rate
7.39%
Mortgage Type
Fannie Mae Freddie Mac
Purchase Details
Closed on
Aug 29, 1997
Sold by
Ile Barbara Ann and Lane Audrey Jean
Bought by
Leavy David C and Leavy Carolyn Y
Home Financials for this Owner
Home Financials are based on the most recent Mortgage that was taken out on this home.
Original Mortgage
$82,055
Interest Rate
7.54%
Mortgage Type
FHA
Create a Home Valuation Report for This Property
The Home Valuation Report is an in-depth analysis detailing your home's value as well as a comparison with similar homes in the area
Home Values in the Area
Average Home Value in this Area
Purchase History
| Date | Buyer | Sale Price | Title Company |
|---|---|---|---|
| Sanchez Jose J | $150,000 | Law Title Joliet | |
| Perez Carlos | $136,000 | None Available | |
| Leavy David C | -- | -- |
Source: Public Records
Mortgage History
| Date | Status | Borrower | Loan Amount |
|---|---|---|---|
| Open | Sanchez Jose J | $16,489 | |
| Previous Owner | Perez Carlos | $122,400 | |
| Previous Owner | Leavy David C | $82,055 |
Source: Public Records
Tax History Compared to Growth
Tax History
| Year | Tax Paid | Tax Assessment Tax Assessment Total Assessment is a certain percentage of the fair market value that is determined by local assessors to be the total taxable value of land and additions on the property. | Land | Improvement |
|---|---|---|---|---|
| 2024 | $4,846 | $71,986 | $12,553 | $59,433 |
| 2023 | $4,770 | $64,771 | $11,295 | $53,476 |
| 2022 | $4,253 | $54,848 | $11,295 | $43,553 |
| 2021 | $4,148 | $51,788 | $10,665 | $41,123 |
| 2020 | $4,076 | $50,623 | $10,425 | $40,198 |
| 2019 | $3,979 | $48,057 | $9,897 | $38,160 |
| 2018 | $3,345 | $39,708 | $9,701 | $30,007 |
| 2017 | $3,195 | $37,145 | $9,075 | $28,070 |
| 2016 | $2,864 | $32,037 | $8,787 | $23,250 |
| 2015 | -- | $25,136 | $8,234 | $16,902 |
| 2014 | -- | $22,681 | $8,007 | $14,674 |
| 2013 | -- | $23,375 | $8,252 | $15,123 |
Source: Public Records
Map
Nearby Homes