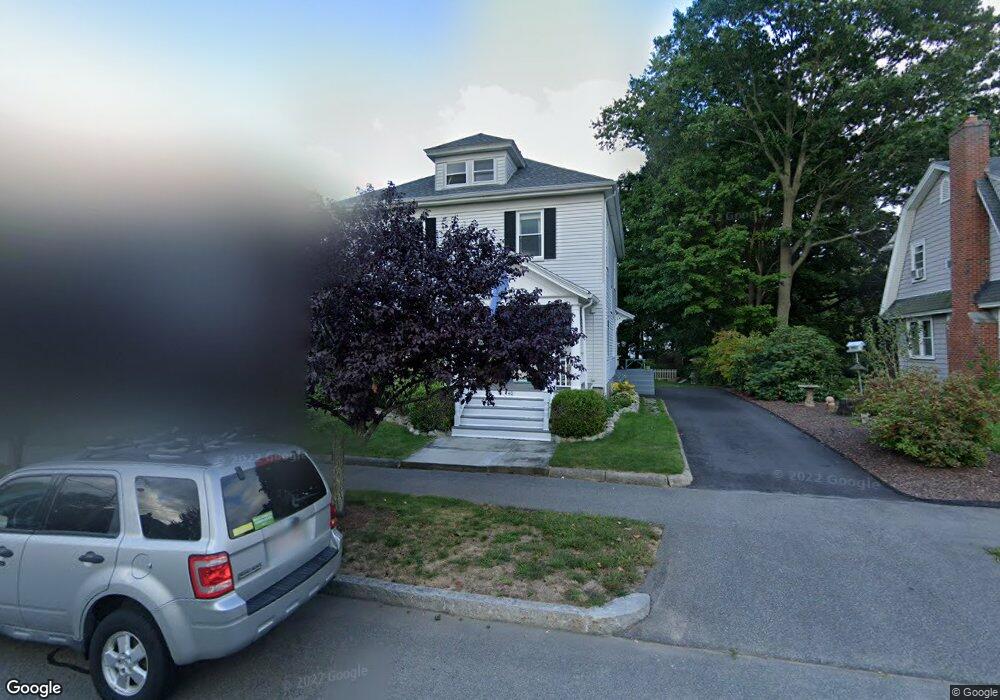
40 Bouve Ave Brockton, MA 02301
Clifton Heights NeighborhoodEstimated Value: $385,000 - $545,000
4
Beds
1
Bath
1,806
Sq Ft
$270/Sq Ft
Est. Value
About This Home
This home is located at 40 Bouve Ave, Brockton, MA 02301 and is currently estimated at $486,870, approximately $269 per square foot. 40 Bouve Ave is a home located in Plymouth County with nearby schools including John F. Kennedy Elementary School, Davis K-8 School, and South Middle School.
Ownership History
Date
Name
Owned For
Owner Type
Purchase Details
Closed on
Apr 13, 1990
Sold by
Hennessey James E
Bought by
Byers Arthur C
Current Estimated Value
Home Financials for this Owner
Home Financials are based on the most recent Mortgage that was taken out on this home.
Original Mortgage
$126,562
Interest Rate
10.13%
Mortgage Type
Purchase Money Mortgage
Create a Home Valuation Report for This Property
The Home Valuation Report is an in-depth analysis detailing your home's value as well as a comparison with similar homes in the area
Home Values in the Area
Average Home Value in this Area
Purchase History
| Date | Buyer | Sale Price | Title Company |
|---|---|---|---|
| Byers Arthur C | $125,000 | -- |
Source: Public Records
Mortgage History
| Date | Status | Borrower | Loan Amount |
|---|---|---|---|
| Open | Byers Arthur C | $105,000 | |
| Closed | Byers Arthur C | $114,720 | |
| Closed | Byers Arthur C | $20,000 | |
| Closed | Byers Arthur C | $126,562 |
Source: Public Records
Tax History Compared to Growth
Tax History
| Year | Tax Paid | Tax Assessment Tax Assessment Total Assessment is a certain percentage of the fair market value that is determined by local assessors to be the total taxable value of land and additions on the property. | Land | Improvement |
|---|---|---|---|---|
| 2025 | $5,000 | $412,900 | $140,900 | $272,000 |
| 2024 | $4,830 | $401,800 | $140,900 | $260,900 |
| 2023 | $4,983 | $383,900 | $108,600 | $275,300 |
| 2022 | $4,849 | $347,100 | $98,800 | $248,300 |
| 2021 | $4,179 | $288,200 | $83,000 | $205,200 |
| 2020 | $4,175 | $275,600 | $76,800 | $198,800 |
| 2019 | $3,787 | $243,700 | $74,600 | $169,100 |
| 2018 | $3,633 | $236,100 | $74,600 | $161,500 |
| 2017 | $3,375 | $209,600 | $74,600 | $135,000 |
| 2016 | $3,566 | $205,400 | $72,600 | $132,800 |
| 2015 | $2,933 | $161,600 | $72,600 | $89,000 |
| 2014 | $2,729 | $150,500 | $72,600 | $77,900 |
Source: Public Records
Map
Nearby Homes
- 44 Bouve Ave
- 32 Bouve Ave
- 50 Bouve Ave
- 26 Bouve Ave
- 31 Bouve Ave
- 47 Bouve Ave
- 56 Bouve Ave
- 49 Bouve Ave
- 249 Grafton St Unit 3
- 249 Grafton St Unit 2
- 249 Grafton St Unit 1
- 249 Grafton St
- 241 Grafton St
- 235 Grafton St
- 20 Bouve Ave
- 233 Grafton St
- 60 Bouve Ave
- 11 Verne St
- 11 Verne St Unit 2
- 243 Grafton St