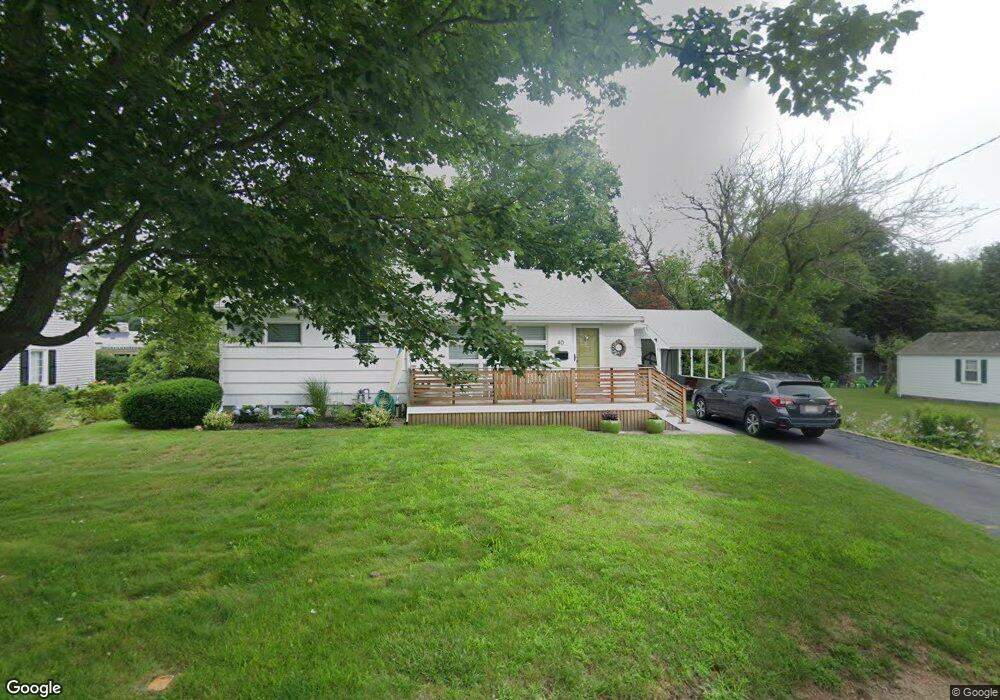
40 Brewster St South Dartmouth, MA 02748
Dartmouth Community Park NeighborhoodEstimated Value: $519,000 - $622,000
2
Beds
1
Bath
1,211
Sq Ft
$482/Sq Ft
Est. Value
About This Home
This home is located at 40 Brewster St, South Dartmouth, MA 02748 and is currently estimated at $583,963, approximately $482 per square foot. 40 Brewster St is a home located in Bristol County with nearby schools including Dartmouth High School and St. Teresa of Calcutta School.
Ownership History
Date
Name
Owned For
Owner Type
Purchase Details
Closed on
Nov 14, 2022
Sold by
Chomak Nina and Lawton Kyra C
Bought by
Nina Chomak Ret
Current Estimated Value
Purchase Details
Closed on
Mar 18, 2021
Sold by
Chomak Nina
Bought by
Chomak Nina and Lawton Kyra C
Purchase Details
Closed on
Nov 25, 2020
Sold by
Baumann Charles M and Baumann Michael J
Bought by
Chomak Nina
Home Financials for this Owner
Home Financials are based on the most recent Mortgage that was taken out on this home.
Original Mortgage
$313,200
Interest Rate
2.8%
Mortgage Type
New Conventional
Create a Home Valuation Report for This Property
The Home Valuation Report is an in-depth analysis detailing your home's value as well as a comparison with similar homes in the area
Home Values in the Area
Average Home Value in this Area
Purchase History
| Date | Buyer | Sale Price | Title Company |
|---|---|---|---|
| Nina Chomak Ret | -- | None Available | |
| Chomak Nina | -- | None Available | |
| Chomak Nina | $365,000 | None Available |
Source: Public Records
Mortgage History
| Date | Status | Borrower | Loan Amount |
|---|---|---|---|
| Previous Owner | Chomak Nina | $313,200 |
Source: Public Records
Tax History Compared to Growth
Tax History
| Year | Tax Paid | Tax Assessment Tax Assessment Total Assessment is a certain percentage of the fair market value that is determined by local assessors to be the total taxable value of land and additions on the property. | Land | Improvement |
|---|---|---|---|---|
| 2025 | $4,056 | $471,100 | $274,800 | $196,300 |
| 2024 | $3,913 | $450,300 | $262,900 | $187,400 |
| 2023 | $3,746 | $408,500 | $239,000 | $169,500 |
| 2022 | $3,614 | $365,000 | $224,600 | $140,400 |
| 2021 | $3,467 | $334,700 | $206,500 | $128,200 |
| 2020 | $3,464 | $333,700 | $211,100 | $122,600 |
| 2019 | $3,433 | $330,100 | $208,800 | $121,300 |
| 2018 | $3,134 | $310,800 | $203,000 | $107,800 |
| 2017 | $3,091 | $308,500 | $202,400 | $106,100 |
| 2016 | $2,936 | $289,000 | $189,300 | $99,700 |
| 2015 | $2,963 | $292,200 | $191,200 | $101,000 |
| 2014 | $2,668 | $261,300 | $162,300 | $99,000 |
Source: Public Records
Map
Nearby Homes