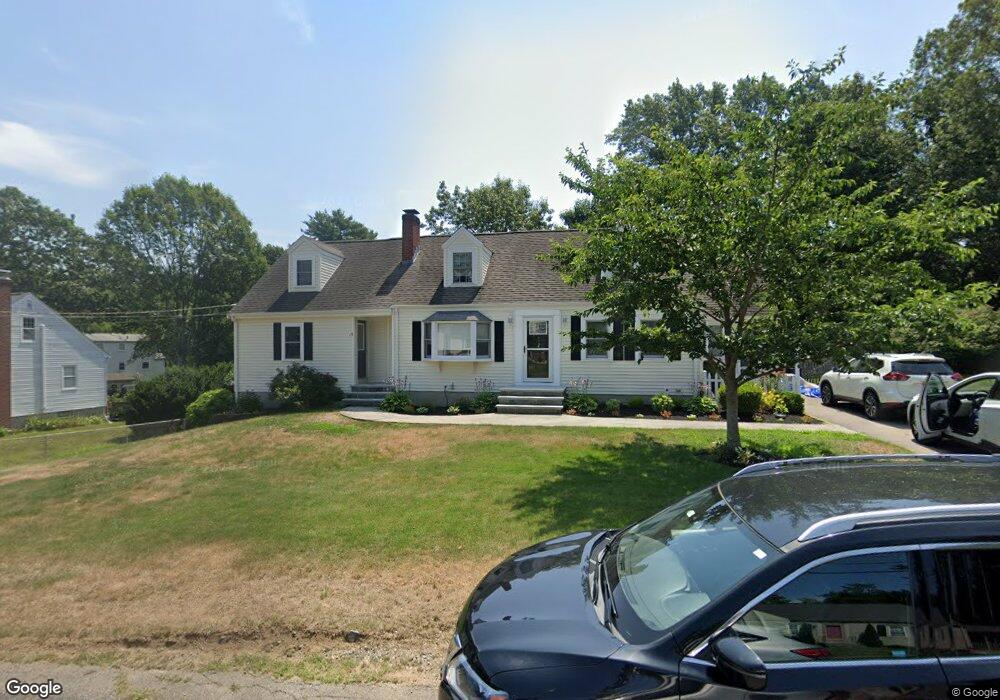
40 Broad St Walpole, MA 02081
Estimated Value: $695,000 - $893,000
3
Beds
2
Baths
1,596
Sq Ft
$487/Sq Ft
Est. Value
About This Home
This home is located at 40 Broad St, Walpole, MA 02081 and is currently estimated at $776,760, approximately $486 per square foot. 40 Broad St is a home located in Norfolk County with nearby schools including Elm Street School, Eleanor N. Johnson Middle School, and Walpole High School.
Ownership History
Date
Name
Owned For
Owner Type
Purchase Details
Closed on
Feb 28, 2006
Sold by
Abril Roseann and Abril Todd C
Bought by
Needham James and Needham Kellie A
Current Estimated Value
Home Financials for this Owner
Home Financials are based on the most recent Mortgage that was taken out on this home.
Original Mortgage
$328,000
Outstanding Balance
$177,912
Interest Rate
6.17%
Mortgage Type
Purchase Money Mortgage
Estimated Equity
$598,848
Purchase Details
Closed on
Jun 30, 2003
Sold by
Stanton Brian and Stanton Catherine A
Bought by
Abril Todd and Abril Roseann S
Home Financials for this Owner
Home Financials are based on the most recent Mortgage that was taken out on this home.
Original Mortgage
$165,000
Interest Rate
5.53%
Mortgage Type
Purchase Money Mortgage
Purchase Details
Closed on
Oct 11, 1996
Sold by
Stelmarsh Phyllis
Bought by
Stanton Brian and Stanton Catherine A
Create a Home Valuation Report for This Property
The Home Valuation Report is an in-depth analysis detailing your home's value as well as a comparison with similar homes in the area
Home Values in the Area
Average Home Value in this Area
Purchase History
We collect this data history from publicly available records. To have your information removed, we recommend requesting removal directly through your county’s website.
| Date | Buyer | Sale Price | Title Company |
|---|---|---|---|
| Needham James | $410,000 | -- | |
| Needham James | $410,000 | -- | |
| Abril Todd | $390,000 | -- | |
| Abril Todd | $390,000 | -- | |
| Stanton Brian | $145,000 | -- |
Source: Public Records
Mortgage History
We collect this data history from publicly available records. To have your information removed, we recommend requesting removal directly through your county’s website.
| Date | Status | Borrower | Loan Amount |
|---|---|---|---|
| Open | Needham James | $328,000 | |
| Closed | Stanton Brian | $328,000 | |
| Previous Owner | Abril Todd | $165,000 |
Source: Public Records
Tax History
| Year | Tax Paid | Tax Assessment Tax Assessment Total Assessment is a certain percentage of the fair market value that is determined by local assessors to be the total taxable value of land and additions on the property. | Land | Improvement |
|---|---|---|---|---|
| 2025 | $9,245 | $720,600 | $316,200 | $404,400 |
| 2024 | $8,950 | $677,000 | $304,000 | $373,000 |
| 2023 | $8,590 | $618,400 | $264,400 | $354,000 |
| 2022 | $8,098 | $560,000 | $244,800 | $315,200 |
| 2021 | $7,611 | $512,900 | $231,000 | $281,900 |
| 2020 | $7,371 | $491,700 | $217,900 | $273,800 |
| 2019 | $7,194 | $476,400 | $209,500 | $266,900 |
| 2018 | $6,928 | $453,700 | $201,500 | $252,200 |
| 2017 | $6,699 | $437,000 | $193,800 | $243,200 |
| 2016 | $6,543 | $420,500 | $186,300 | $234,200 |
| 2015 | $6,319 | $402,500 | $177,200 | $225,300 |
| 2014 | $6,031 | $382,700 | $177,200 | $205,500 |
Source: Public Records
Map
Nearby Homes
- 24 Marion St
- 1429 Main St Unit 5E
- 1391 Main St Unit 305
- 1391 Main St Unit 301
- 9 Macdonald Cir
- 19 Audubon Dr
- 10 Weathervane Dr Unit 20
- 9 Bates Quarry Ln Unit 47
- 7 Bates Quarry Ln Unit 46
- 16 Weathervane Dr Unit 23
- 124 Clear Pond Dr
- 29 Merganser Way Unit 29
- 3 Weathervane Dr Unit 1
- 25 Sandtrap Cir Unit 8
- 6 Teal Cir
- 16 Canvasback Way Unit 16
- 120 Spring St
- 11 Canvasback Way
- 21 Chandler Ave
- 24 Riverside Place
Your Personal Tour Guide
Ask me questions while you tour the home.