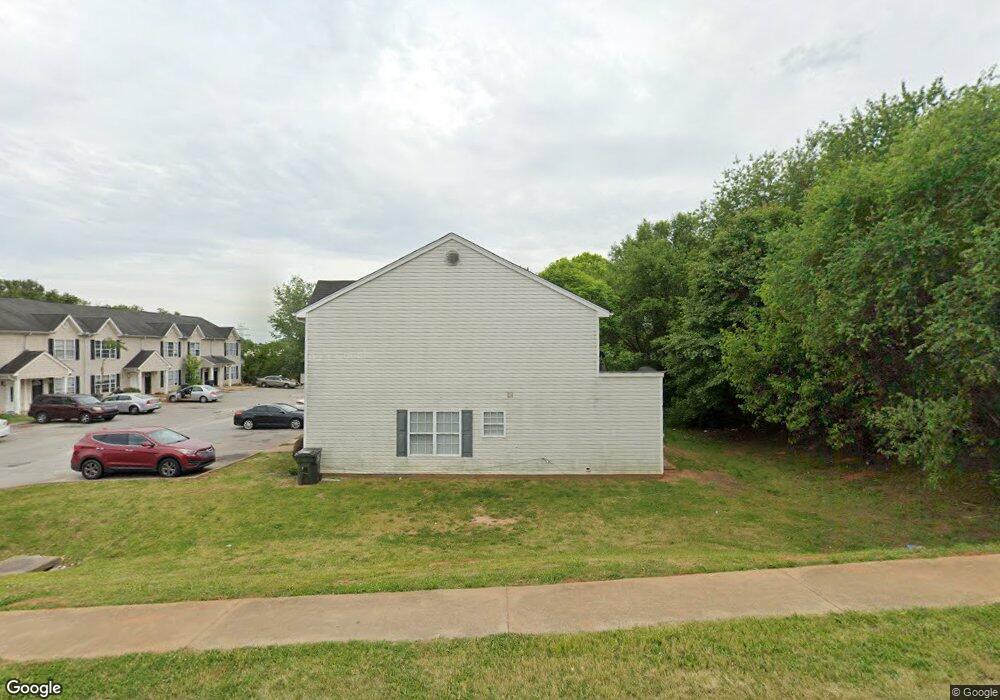
40 Buff St Unit C-4 Greenville, SC 29609
Sans Souci NeighborhoodEstimated Value: $174,000 - $196,000
3
Beds
2
Baths
1,320
Sq Ft
$138/Sq Ft
Est. Value
About This Home
This home is located at 40 Buff St Unit C-4, Greenville, SC 29609 and is currently estimated at $182,709, approximately $138 per square foot. 40 Buff St Unit C-4 is a home located in Greenville County with nearby schools including Cherrydale Elementary, Lakeview Middle, and Greenville Senior High School.
Ownership History
Date
Name
Owned For
Owner Type
Purchase Details
Closed on
Aug 19, 2024
Sold by
Buff Street Llc
Bought by
Boules Kirollos and Ibrahim Dina
Current Estimated Value
Home Financials for this Owner
Home Financials are based on the most recent Mortgage that was taken out on this home.
Original Mortgage
$134,400
Outstanding Balance
$132,353
Interest Rate
6.78%
Mortgage Type
New Conventional
Estimated Equity
$50,356
Purchase Details
Closed on
Nov 2, 2023
Sold by
Cobran Properties Llc
Bought by
Buff Street Llc
Purchase Details
Closed on
May 8, 2012
Sold by
Deutsche Bank National Trust Company
Bought by
Conbran Properties Llc
Purchase Details
Closed on
Dec 31, 2011
Sold by
Mozie John and Mozie Angela
Bought by
Deutsche Bank National Trust Company
Purchase Details
Closed on
Mar 26, 2008
Sold by
Mozie John and Mozie Angela
Bought by
Mozie John and Mozie Angela
Create a Home Valuation Report for This Property
The Home Valuation Report is an in-depth analysis detailing your home's value as well as a comparison with similar homes in the area
Home Values in the Area
Average Home Value in this Area
Purchase History
| Date | Buyer | Sale Price | Title Company |
|---|---|---|---|
| Boules Kirollos | $168,000 | None Listed On Document | |
| Boules Kirollos | $168,000 | None Listed On Document | |
| Buff Street Llc | $216,000 | None Listed On Document | |
| Conbran Properties Llc | $25,000 | -- | |
| Deutsche Bank National Trust Company | -- | -- | |
| Mozie John | -- | None Available |
Source: Public Records
Mortgage History
| Date | Status | Borrower | Loan Amount |
|---|---|---|---|
| Open | Boules Kirollos | $134,400 | |
| Closed | Boules Kirollos | $134,400 |
Source: Public Records
Tax History
| Year | Tax Paid | Tax Assessment Tax Assessment Total Assessment is a certain percentage of the fair market value that is determined by local assessors to be the total taxable value of land and additions on the property. | Land | Improvement |
|---|---|---|---|---|
| 2025 | $3,551 | $9,540 | $1,910 | $7,630 |
| 2024 | $3,551 | $3,070 | $440 | $2,630 |
| 2023 | $1,414 | $2,510 | $430 | $2,080 |
| 2022 | $1,161 | $2,510 | $430 | $2,080 |
| 2021 | $1,270 | $2,510 | $430 | $2,080 |
| 2020 | $1,203 | $2,180 | $130 | $2,050 |
| 2019 | $1,187 | $2,180 | $130 | $2,050 |
| 2018 | $1,067 | $2,180 | $130 | $2,050 |
| 2017 | $1,055 | $2,180 | $130 | $2,050 |
| 2016 | $1,010 | $36,290 | $2,200 | $34,090 |
| 2015 | $1,087 | $40,110 | $1,720 | $38,390 |
| 2014 | $972 | $34,880 | $5,400 | $29,480 |
Source: Public Records
Map
Nearby Homes
Your Personal Tour Guide
Ask me questions while you tour the home.