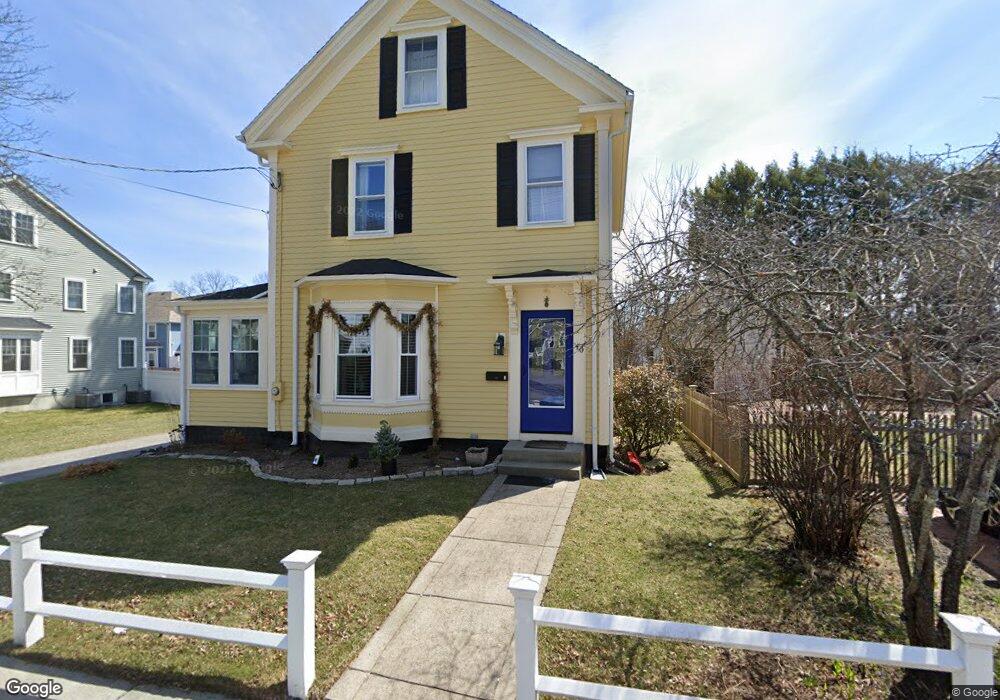
40 Canal St Winchester, MA 01890
North Main NeighborhoodEstimated Value: $1,168,000 - $1,259,000
5
Beds
2
Baths
2,202
Sq Ft
$549/Sq Ft
Est. Value
About This Home
This home is located at 40 Canal St, Winchester, MA 01890 and is currently estimated at $1,207,980, approximately $548 per square foot. 40 Canal St is a home located in Middlesex County with nearby schools including Lynch Elementary School, McCall Middle School, and Winchester High School.
Ownership History
Date
Name
Owned For
Owner Type
Purchase Details
Closed on
Dec 22, 2005
Sold by
Drachman Jessica G and Blaustein Jessica
Bought by
Lannon Mary Ellen
Current Estimated Value
Home Financials for this Owner
Home Financials are based on the most recent Mortgage that was taken out on this home.
Original Mortgage
$359,650
Interest Rate
6.36%
Mortgage Type
Purchase Money Mortgage
Purchase Details
Closed on
Aug 17, 1993
Sold by
Schodek Daniel L and Schodek Elizabeth K
Bought by
Blaustein Marc B and Drachman Jessica G
Create a Home Valuation Report for This Property
The Home Valuation Report is an in-depth analysis detailing your home's value as well as a comparison with similar homes in the area
Home Values in the Area
Average Home Value in this Area
Purchase History
| Date | Buyer | Sale Price | Title Company |
|---|---|---|---|
| Lannon Mary Ellen | $535,000 | -- | |
| Blaustein Marc B | $242,000 | -- |
Source: Public Records
Mortgage History
| Date | Status | Borrower | Loan Amount |
|---|---|---|---|
| Open | Blaustein Marc B | $400,100 | |
| Closed | Lannon Mary Ellen | $359,650 |
Source: Public Records
Tax History Compared to Growth
Tax History
| Year | Tax Paid | Tax Assessment Tax Assessment Total Assessment is a certain percentage of the fair market value that is determined by local assessors to be the total taxable value of land and additions on the property. | Land | Improvement |
|---|---|---|---|---|
| 2025 | $115 | $1,039,100 | $610,400 | $428,700 |
| 2024 | $11,129 | $982,300 | $578,200 | $404,100 |
| 2023 | $10,915 | $925,000 | $530,100 | $394,900 |
| 2022 | $10,826 | $865,400 | $481,900 | $383,500 |
| 2021 | $375 | $793,100 | $409,600 | $383,500 |
| 2020 | $7,258 | $793,100 | $409,600 | $383,500 |
| 2019 | $8,632 | $712,800 | $329,300 | $383,500 |
| 2018 | $8,493 | $696,700 | $313,200 | $383,500 |
| 2017 | $7,940 | $646,600 | $297,200 | $349,400 |
| 2016 | $7,259 | $621,500 | $297,200 | $324,300 |
| 2015 | $7,203 | $593,300 | $269,000 | $324,300 |
| 2014 | $6,795 | $536,700 | $232,900 | $303,800 |
Source: Public Records
Map
Nearby Homes
- 62 Richardson St
- 237 Swanton St
- 29 Shepard Ct
- 20 Arthur St
- 149 Horn Pond Brook Rd
- 200 Swanton St Unit 228
- 200 Swanton St Unit 636
- 200 Swanton St Unit 234
- 200 Swanton St Unit T28
- 14 Cross St
- 171 Swanton St Unit 73
- 32 Woodside Rd
- 9 Norfolk Rd
- 666 Main St Unit 312
- 666 Main St Unit 315
- 6 Ivy Cir
- 2 George Rd Unit 2
- 95 Irving St
- 36 Elmwood Ave Unit 2
- 14 Ash St