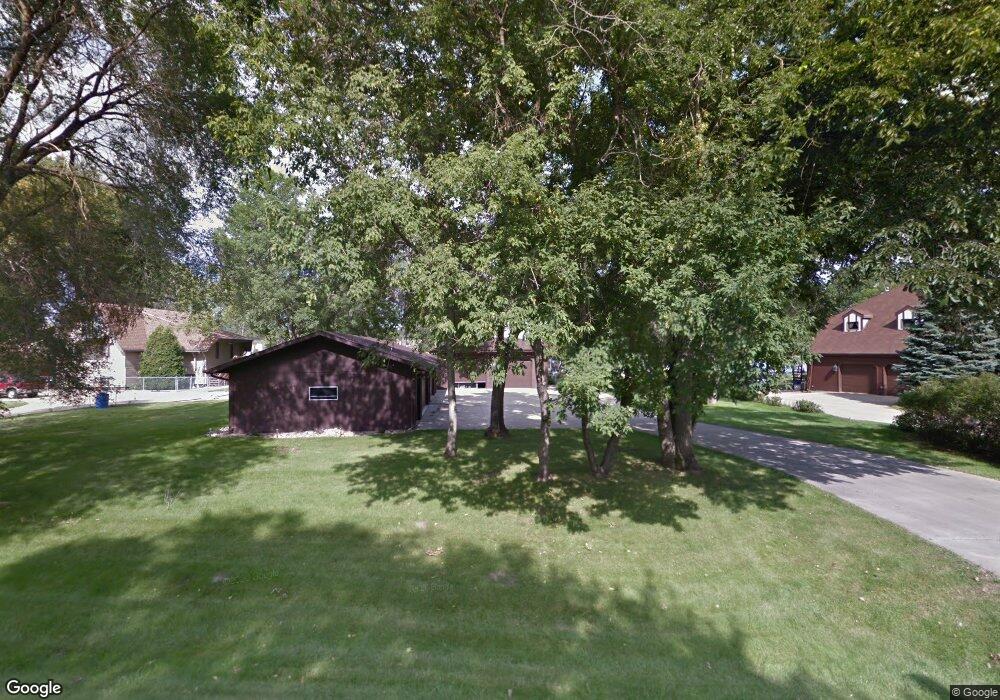
40 Captain Marsh Dr Mandan, ND 58554
Estimated Value: $645,000 - $785,000
4
Beds
3
Baths
2,640
Sq Ft
$270/Sq Ft
Est. Value
About This Home
This home is located at 40 Captain Marsh Dr, Mandan, ND 58554 and is currently estimated at $713,941, approximately $270 per square foot. 40 Captain Marsh Dr is a home located in Morton County with nearby schools including Lewis & Clark Elementary School, Mandan Middle School, and Mandan High School.
Ownership History
Date
Name
Owned For
Owner Type
Purchase Details
Closed on
Mar 17, 2005
Sold by
Barnes Terry L and Barnes Nancy L
Bought by
Zerb Kenneth
Current Estimated Value
Home Financials for this Owner
Home Financials are based on the most recent Mortgage that was taken out on this home.
Original Mortgage
$115,000
Interest Rate
5.64%
Mortgage Type
New Conventional
Create a Home Valuation Report for This Property
The Home Valuation Report is an in-depth analysis detailing your home's value as well as a comparison with similar homes in the area
Home Values in the Area
Average Home Value in this Area
Purchase History
| Date | Buyer | Sale Price | Title Company |
|---|---|---|---|
| Zerb Kenneth | -- | None Available |
Source: Public Records
Mortgage History
| Date | Status | Borrower | Loan Amount |
|---|---|---|---|
| Closed | Zerb Kenneth | $115,000 |
Source: Public Records
Tax History
| Year | Tax Paid | Tax Assessment Tax Assessment Total Assessment is a certain percentage of the fair market value that is determined by local assessors to be the total taxable value of land and additions on the property. | Land | Improvement |
|---|---|---|---|---|
| 2024 | $57 | $254,450 | $0 | $0 |
| 2023 | $5,477 | $269,750 | $67,200 | $202,550 |
| 2022 | $4,119 | $202,750 | $41,700 | $161,050 |
| 2021 | $3,769 | $185,200 | $46,400 | $138,800 |
| 2020 | $3,530 | $182,150 | $46,400 | $135,750 |
| 2019 | $3,573 | $179,600 | $0 | $0 |
| 2018 | $3,432 | $179,500 | $46,400 | $133,100 |
| 2017 | $3,394 | $179,300 | $46,400 | $132,900 |
| 2016 | $3,148 | $170,600 | $46,400 | $124,200 |
| 2015 | $3,017 | $163,850 | $46,400 | $117,450 |
| 2014 | $3,164 | $171,450 | $48,700 | $122,750 |
| 2013 | $3,056 | $159,000 | $46,400 | $112,600 |
Source: Public Records
Map
Nearby Homes
- 57 Captain Marsh Dr
- 2109 Bridgeview Ct SE
- 2207 Bridgeview Ct
- 2313 Pirates Loop SE
- 4500 Sundancer Loop SE Unit 2
- 2120 Sundancer Loop SE Unit 5
- 2200 Shoal Loop SE
- 1005 W Highland Acres Rd
- 2445 Waterpark Loop SE
- 2454 Waterpark Loop SE
- 1120 Keating Dr
- 2617 Verity Ln SE
- 2625 Douglas Place SE
- 3714 Amity Cir SE
- 1232 E Coulee Rd
- 4020 Mckenzie Dr SE Unit 5
- 4004 Bayport Place SE
- 3801 Gale Cir SE
- 4103 Bayport Place SE
- 3507 24th St SE
- 39 Captain Marsh Dr
- 41 Captain Marsh Dr
- 38 Captain Marsh Dr
- 42 Captain Marsh Dr
- 51 Captain Marsh Dr
- 52 Captain Marsh Dr
- 50 Captain Marsh Dr
- 43 Captain Marsh Dr
- 59 Captain Marsh Dr
- 37 Captain Marsh Dr
- 0 Captain Marsh Dr
- 53 Captain Marsh Dr
- 49 Captain Marsh Dr
- 54 Captain Marsh Dr
- 44 Captain Marsh Dr
- 36 Captain Marsh Dr
- 55 Captain Marsh Dr
- 45 Captain Marsh Dr
- 60 Captain Marsh Dr
- 62 Captain Leach Dr
Your Personal Tour Guide
Ask me questions while you tour the home.