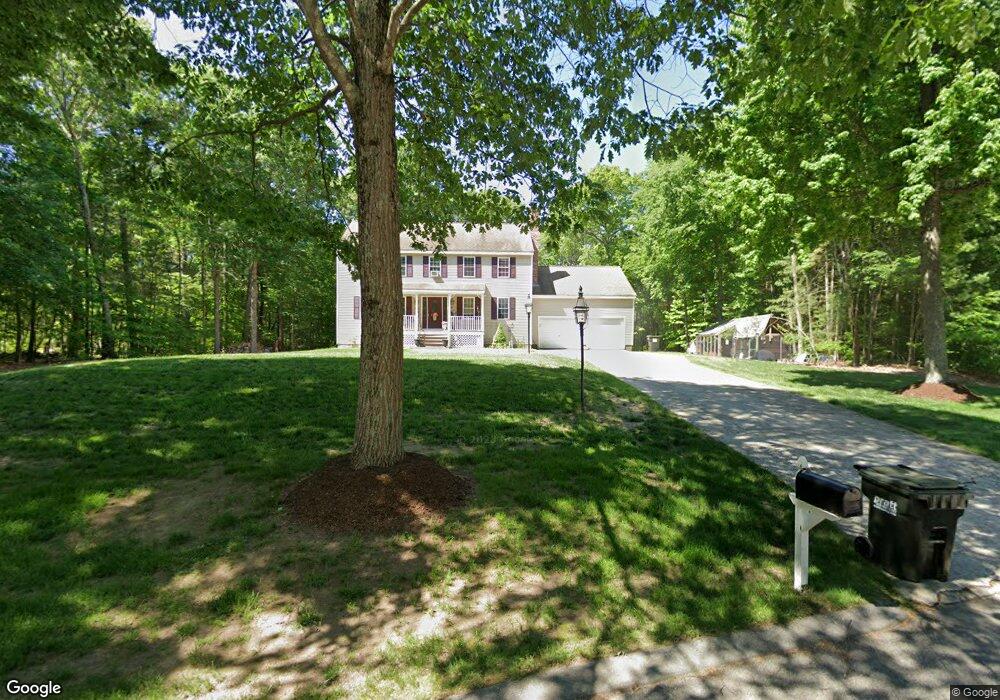
40 Cassie Ln Uxbridge, MA 01569
Estimated Value: $598,000 - $802,000
3
Beds
3
Baths
2,256
Sq Ft
$306/Sq Ft
Est. Value
About This Home
This home is located at 40 Cassie Ln, Uxbridge, MA 01569 and is currently estimated at $690,194, approximately $305 per square foot. 40 Cassie Ln is a home located in Worcester County with nearby schools including Uxbridge High School and Our Lady of the Valley Regional School.
Ownership History
Date
Name
Owned For
Owner Type
Purchase Details
Closed on
Sep 1, 2000
Sold by
Ja Taylor Constr
Bought by
Guertin Thomas R and Guertin Helen
Current Estimated Value
Home Financials for this Owner
Home Financials are based on the most recent Mortgage that was taken out on this home.
Original Mortgage
$236,000
Interest Rate
8.16%
Mortgage Type
Purchase Money Mortgage
Create a Home Valuation Report for This Property
The Home Valuation Report is an in-depth analysis detailing your home's value as well as a comparison with similar homes in the area
Home Values in the Area
Average Home Value in this Area
Purchase History
| Date | Buyer | Sale Price | Title Company |
|---|---|---|---|
| Guertin Thomas R | $287,030 | -- |
Source: Public Records
Mortgage History
| Date | Status | Borrower | Loan Amount |
|---|---|---|---|
| Open | Guertin Thomas R | $150,000 | |
| Closed | Guertin Thomas R | $130,500 | |
| Closed | Guertin Thomas R | $225,500 | |
| Closed | Guertin Thomas R | $236,000 |
Source: Public Records
Tax History Compared to Growth
Tax History
| Year | Tax Paid | Tax Assessment Tax Assessment Total Assessment is a certain percentage of the fair market value that is determined by local assessors to be the total taxable value of land and additions on the property. | Land | Improvement |
|---|---|---|---|---|
| 2025 | $80 | $607,500 | $174,700 | $432,800 |
| 2024 | $7,552 | $584,500 | $166,000 | $418,500 |
| 2023 | $7,202 | $516,300 | $143,200 | $373,100 |
| 2022 | $6,523 | $430,300 | $125,800 | $304,500 |
| 2021 | $6,766 | $427,700 | $123,200 | $304,500 |
| 2020 | $6,639 | $396,600 | $121,400 | $275,200 |
| 2019 | $6,570 | $378,700 | $121,400 | $257,300 |
| 2018 | $6,399 | $372,700 | $121,400 | $251,300 |
| 2017 | $5,899 | $347,800 | $111,700 | $236,100 |
| 2016 | $6,127 | $348,700 | $106,400 | $242,300 |
| 2015 | $5,984 | $343,900 | $106,400 | $237,500 |
Source: Public Records
Map
Nearby Homes
- 7 Jefferson Ct Unit 7
- 145 Mantell Rd
- 169 Mantell Rd
- 137 Mantell Rd
- 11 Summerfield Dr Unit 11
- 125 Saint Andre Dr
- 71 Rivulet St Unit B
- 0 Homestead Ave
- 395 High St
- 36 Elm St
- 13 Blanchard Ave
- 235 Rivulet St
- 129 Elm St Unit Lot 7
- 288 High St
- 307 N Main St
- 99 Country Club Dr
- 3 Strathmore Shire Unit A
- 4 Strathmore Shire Dr Unit B
- 37 Bayliss Way
- 22 Bayliss Way