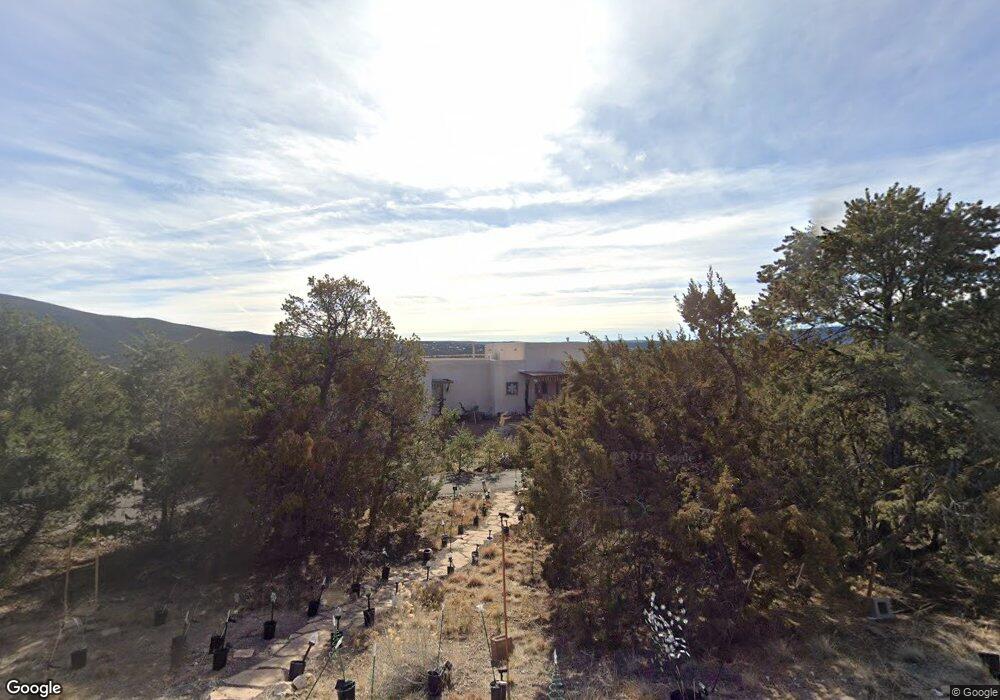
40 Chaco Loop Sandia Park, NM 87047
Estimated Value: $694,000 - $806,000
3
Beds
3
Baths
3,450
Sq Ft
$210/Sq Ft
Est. Value
About This Home
This home is located at 40 Chaco Loop, Sandia Park, NM 87047 and is currently estimated at $724,698, approximately $210 per square foot. 40 Chaco Loop is a home located in Bernalillo County with nearby schools including San Antonito Elementary School, Roosevelt Middle School, and Manzano High School.
Ownership History
Date
Name
Owned For
Owner Type
Purchase Details
Closed on
Aug 28, 2008
Sold by
Traudt David K and Loose Ann A
Bought by
Traudt David K and Loose Ann A
Current Estimated Value
Purchase Details
Closed on
Jun 6, 2001
Sold by
Dennett J Joseph and Dennett Elena C
Bought by
Traudt David K and Loose Ann A
Home Financials for this Owner
Home Financials are based on the most recent Mortgage that was taken out on this home.
Original Mortgage
$107,200
Interest Rate
7.1%
Create a Home Valuation Report for This Property
The Home Valuation Report is an in-depth analysis detailing your home's value as well as a comparison with similar homes in the area
Home Values in the Area
Average Home Value in this Area
Purchase History
| Date | Buyer | Sale Price | Title Company |
|---|---|---|---|
| Traudt David K | -- | None Available | |
| Traudt David K | -- | Rio Grande Title Company Inc |
Source: Public Records
Mortgage History
| Date | Status | Borrower | Loan Amount |
|---|---|---|---|
| Closed | Traudt David K | $107,200 |
Source: Public Records
Tax History
| Year | Tax Paid | Tax Assessment Tax Assessment Total Assessment is a certain percentage of the fair market value that is determined by local assessors to be the total taxable value of land and additions on the property. | Land | Improvement |
|---|---|---|---|---|
| 2025 | $3,998 | $143,927 | $32,571 | $111,356 |
| 2024 | $4,039 | $139,736 | $31,623 | $108,113 |
| 2023 | $3,971 | $135,666 | $30,702 | $104,964 |
| 2022 | $3,831 | $131,715 | $29,808 | $101,907 |
| 2021 | $3,697 | $127,879 | $28,940 | $98,939 |
| 2020 | $3,633 | $124,154 | $28,097 | $96,057 |
| 2019 | $3,633 | $124,154 | $28,097 | $96,057 |
| 2018 | $3,606 | $124,154 | $28,097 | $96,057 |
| 2017 | $3,599 | $124,154 | $28,097 | $96,057 |
| 2016 | $3,599 | $124,454 | $28,397 | $96,057 |
| 2015 | $124,103 | $124,103 | $29,249 | $94,854 |
| 2014 | $3,571 | $120,488 | $28,397 | $92,091 |
| 2013 | -- | $120,488 | $28,397 | $92,091 |
Source: Public Records
Map
Nearby Homes
- 121 Kiva Place
- 82 Kiva Place
- 113 Paa Ko Dr
- 39 Anasazi Dr
- 61 Twin Arrow Dr
- 153 Paa Ko Dr
- 150 Paa Ko Dr
- 4 Anasazi Ct
- 65 Twin Arrow Dr
- 125 Kiva Place Unit 246
- 58 Moccasin Trail
- 55 Canyon Ridge Dr
- 9 Tigua Dr
- 2 Tigua Dr
- 1 La Madera Dr
- 1 La Madera Dr
- 41 Storyteller Ct
- 6 Storyteller Ct
- 2 Concha Ct
- 37 Shiprock Rd
Your Personal Tour Guide
Ask me questions while you tour the home.