Estimated Value: $447,105 - $525,000
Studio
--
Bath
2,152
Sq Ft
$228/Sq Ft
Est. Value
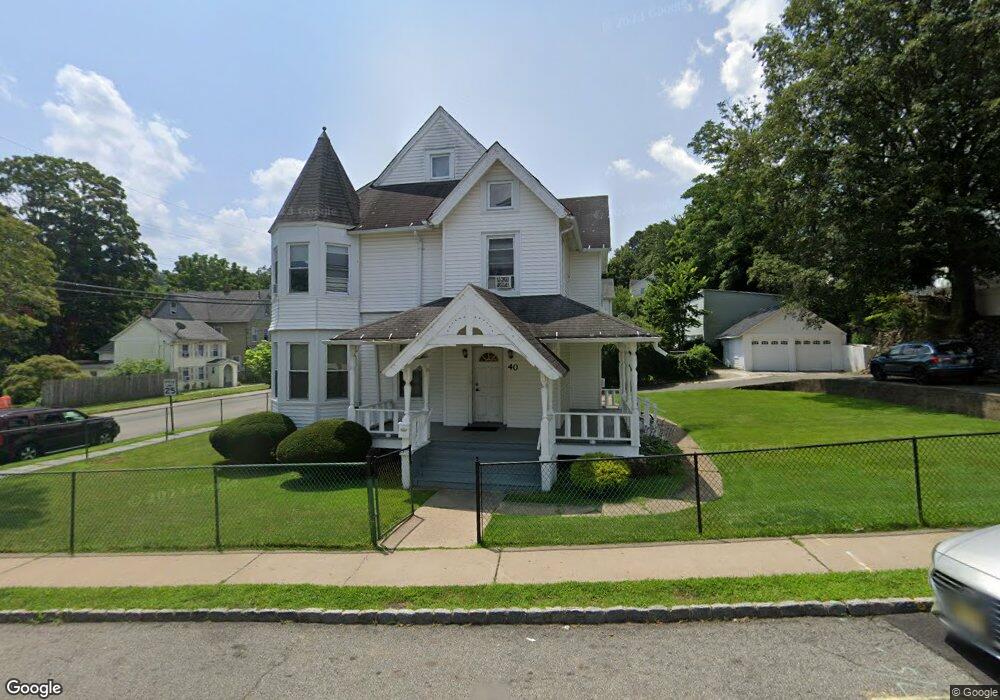
About This Home
This home is located at 40 Chestnut St, Dover, NJ 07801 and is currently estimated at $491,526, approximately $228 per square foot. 40 Chestnut St is a home located in Morris County with nearby schools including Dover Middle School and Dover High School.
Ownership History
Date
Name
Owned For
Owner Type
Purchase Details
Closed on
Nov 26, 2003
Sold by
Saffo Glenn
Bought by
Acevedo Martha
Current Estimated Value
Home Financials for this Owner
Home Financials are based on the most recent Mortgage that was taken out on this home.
Original Mortgage
$256,500
Outstanding Balance
$118,691
Interest Rate
5.86%
Estimated Equity
$372,835
Purchase Details
Closed on
Feb 17, 1995
Sold by
Corti Maria
Bought by
Saffo Glenn and Saffo Pam
Home Financials for this Owner
Home Financials are based on the most recent Mortgage that was taken out on this home.
Original Mortgage
$105,000
Interest Rate
9.17%
Create a Home Valuation Report for This Property
The Home Valuation Report is an in-depth analysis detailing your home's value as well as a comparison with similar homes in the area
Home Values in the Area
Average Home Value in this Area
Purchase History
| Date | Buyer | Sale Price | Title Company |
|---|---|---|---|
| Acevedo Martha | $270,000 | -- | |
| Saffo Glenn | $124,500 | -- |
Source: Public Records
Mortgage History
| Date | Status | Borrower | Loan Amount |
|---|---|---|---|
| Open | Acevedo Martha | $256,500 | |
| Previous Owner | Saffo Glenn | $105,000 |
Source: Public Records
Tax History
| Year | Tax Paid | Tax Assessment Tax Assessment Total Assessment is a certain percentage of the fair market value that is determined by local assessors to be the total taxable value of land and additions on the property. | Land | Improvement |
|---|---|---|---|---|
| 2025 | $7,698 | $235,200 | $90,600 | $144,600 |
| 2024 | $7,425 | $235,200 | $90,600 | $144,600 |
Source: Public Records
Map
Nearby Homes
- 5 A&B Dewey St
- 142 W Blackwell St
- 121 W Clinton St
- 37 Kearney St
- 12 Lincoln Ave
- 179 Pequannock St
- 121 W Munson Ave
- 13 James St
- 3 Marble Ln
- 170 Park Heights Ave
- 126 Princeton Ave
- 8 N Elk Ave
- 417 W Black Well St Ab
- 4 Terry Ln
- 10 Dalrymple St
- 14 Jessica Ln
- 25 Wabash Ave
- 36 Kitchell Ave
- 301 E McFarlan St -A and B
- 4 Sickle St
- 33 Thompson Ave
- 37 Thompson Ave
- 40 Prospect St Unit 42
- 34-36 Thompson Ave A&b
- 34 Thompson Ave A&b
- 44 Prospect St
- 42 Prospect St Unit A
- 42 Prospect St Unit B
- 39 Thompson Ave
- 48 Prospect St
- 41 Thompson Ave
- 34 Chestnut St
- 34 Thompson Ave Unit 36
- 40-42 Prospect St Ab
- 50 Prospect St
- 43 Thompson Ave Unit 45
- 40 Thompson Ave
- 43-45 Thompson Ave
- 54 Prospect St
- 42 Thompson Ave Unit 44
Your Personal Tour Guide
Ask me questions while you tour the home.