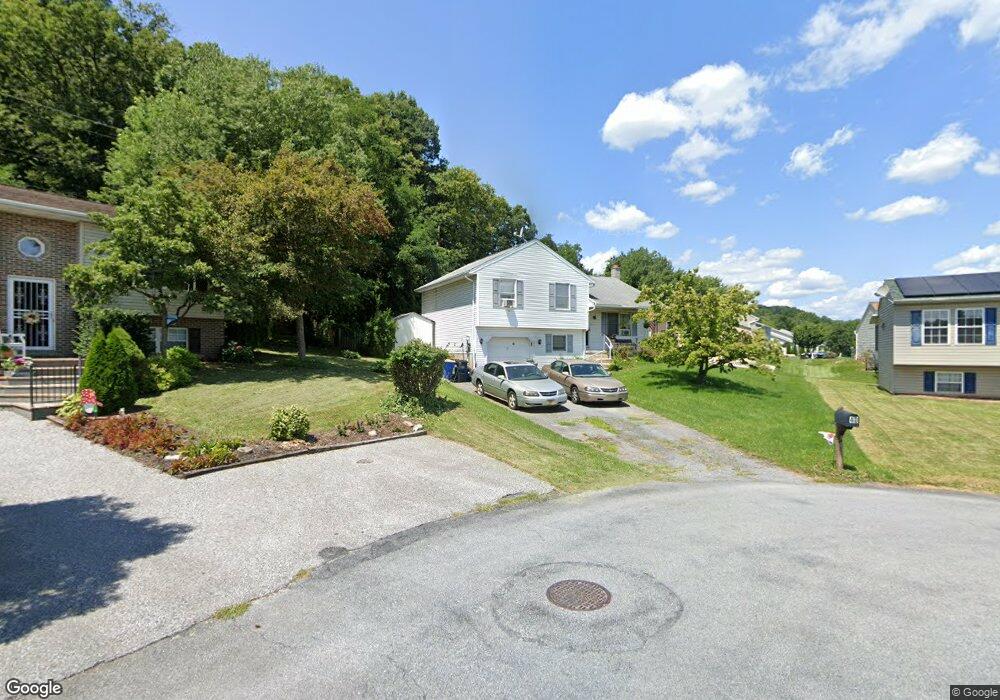
40 Cheyenne Ct York Haven, PA 17370
Estimated Value: $220,000 - $302,000
3
Beds
2
Baths
1,030
Sq Ft
$246/Sq Ft
Est. Value
About This Home
This home is located at 40 Cheyenne Ct, York Haven, PA 17370 and is currently estimated at $253,267, approximately $245 per square foot. 40 Cheyenne Ct is a home located in York County with nearby schools including Northeastern Senior High School.
Ownership History
Date
Name
Owned For
Owner Type
Purchase Details
Closed on
Oct 22, 2009
Sold by
Flickinger Mark A and Flickinger Lisa K
Bought by
Kelley Brian and Kelley Marie
Current Estimated Value
Home Financials for this Owner
Home Financials are based on the most recent Mortgage that was taken out on this home.
Original Mortgage
$151,020
Outstanding Balance
$98,664
Interest Rate
5.09%
Mortgage Type
New Conventional
Estimated Equity
$154,603
Purchase Details
Closed on
Oct 14, 2005
Sold by
Casey Chris J and Casey Judy A
Bought by
Flickinger Mark A and Flickinger Lisa K
Home Financials for this Owner
Home Financials are based on the most recent Mortgage that was taken out on this home.
Original Mortgage
$105,000
Interest Rate
6.39%
Mortgage Type
Fannie Mae Freddie Mac
Create a Home Valuation Report for This Property
The Home Valuation Report is an in-depth analysis detailing your home's value as well as a comparison with similar homes in the area
Home Values in the Area
Average Home Value in this Area
Purchase History
| Date | Buyer | Sale Price | Title Company |
|---|---|---|---|
| Kelley Brian | $148,000 | None Available | |
| Flickinger Mark A | $124,900 | None Available |
Source: Public Records
Mortgage History
| Date | Status | Borrower | Loan Amount |
|---|---|---|---|
| Open | Kelley Brian | $151,020 | |
| Previous Owner | Flickinger Mark A | $105,000 |
Source: Public Records
Tax History Compared to Growth
Tax History
| Year | Tax Paid | Tax Assessment Tax Assessment Total Assessment is a certain percentage of the fair market value that is determined by local assessors to be the total taxable value of land and additions on the property. | Land | Improvement |
|---|---|---|---|---|
| 2025 | $2,903 | $104,790 | $24,800 | $79,990 |
| 2024 | $3,794 | $104,790 | $24,800 | $79,990 |
| 2023 | $6,506 | $104,790 | $24,800 | $79,990 |
| 2022 | $6,468 | $104,790 | $24,800 | $79,990 |
| 2021 | $6,290 | $104,790 | $24,800 | $79,990 |
| 2020 | $6,141 | $104,790 | $24,800 | $79,990 |
| 2019 | $3,615 | $104,790 | $24,800 | $79,990 |
| 2018 | $3,572 | $104,790 | $24,800 | $79,990 |
| 2017 | $3,551 | $104,790 | $24,800 | $79,990 |
| 2016 | $0 | $104,790 | $24,800 | $79,990 |
| 2015 | -- | $104,790 | $24,800 | $79,990 |
| 2014 | -- | $104,790 | $24,800 | $79,990 |
Source: Public Records
Map
Nearby Homes
- 100 Steeple Chase Dr
- 27 E Broadway Ave
- 1335 York Haven Rd
- 9-21 Bentley Ct
- 32 N York St
- 0 Pines Rd Unit 1002665639
- 6 Bentley Ct
- 6-15 Bentley Ct
- 210 Lark Dr
- 20 Crabapple Dr
- 95 Madison Dr
- 285 Thoroughbred Dr
- Pearl Plan at Lexington Estates
- Opal Plan at Lexington Estates
- Jefferson Plan at Lexington Estates
- Emerald Plan at Lexington Estates
- Bristol II Plan at Lexington Estates
- Hamilton Plan at Lexington Estates
- 160 Champions Dr
- Topaz Plan at Lexington Estates
- 30 Cheyenne Ct
- 45 Cheyenne Ct
- 20 Cheyenne Ct
- 35 Cheyenne Ct
- 25 Cheyenne Ct
- 150 Shawnee Trail
- 140 Shawnee Trail
- 15 Cheyenne Ct
- 130 Shawnee Trail
- 105 Shawnee Trail
- 5 Cheyenne Ct
- 10 Cheyenne Ct
- 40 Iroquois Trail
- 95 Shawnee Trail
- 120 Shawnee Trail
- 35 Delaware Dr
- 30 Iroquois Trail
- 50 Delaware Dr
- 25 Delaware Dr
- 85 Shawnee Trail