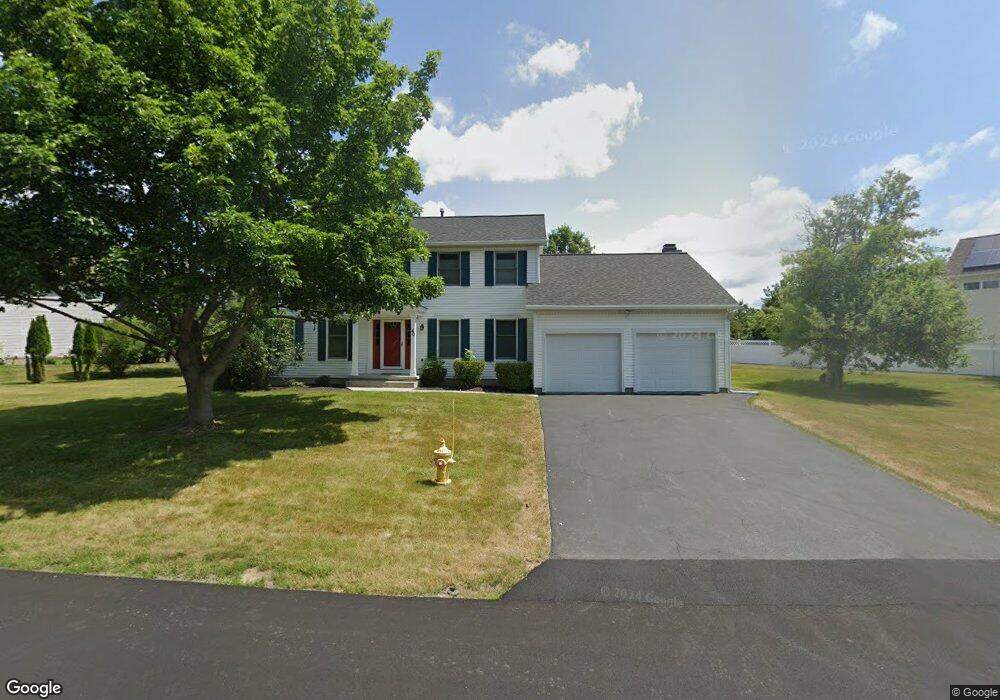
40 Clifton Way Slingerlands, NY 12159
Estimated Value: $543,000 - $621,000
4
Beds
3
Baths
2,393
Sq Ft
$239/Sq Ft
Est. Value
About This Home
This home is located at 40 Clifton Way, Slingerlands, NY 12159 and is currently estimated at $572,551, approximately $239 per square foot. 40 Clifton Way is a home located in Albany County with nearby schools including Westmere Elementary School, Farnsworth Middle School, and Guilderland High School.
Ownership History
Date
Name
Owned For
Owner Type
Purchase Details
Closed on
Nov 24, 2021
Sold by
Lewis Geneva M
Bought by
Okor Nyasha L and Geneva M Lewis Family Trust
Current Estimated Value
Purchase Details
Closed on
Mar 1, 2012
Sold by
Anderson John H
Bought by
Greene John and Greene Susan
Purchase Details
Closed on
Jul 2, 2009
Sold by
Lewis Geneva M
Bought by
Lewis Geneva M
Home Financials for this Owner
Home Financials are based on the most recent Mortgage that was taken out on this home.
Original Mortgage
$217,250
Interest Rate
5.47%
Mortgage Type
New Conventional
Purchase Details
Closed on
Apr 19, 2005
Sold by
Dipasquale Thomas J and Dipasquale Joan
Bought by
Dipasquale Thomas J and Dipasquale Joan
Purchase Details
Closed on
Jan 19, 1995
Sold by
Drake Parc Assoc Inc
Bought by
Lewis Donnie and Lewis Geneva
Create a Home Valuation Report for This Property
The Home Valuation Report is an in-depth analysis detailing your home's value as well as a comparison with similar homes in the area
Home Values in the Area
Average Home Value in this Area
Purchase History
| Date | Buyer | Sale Price | Title Company |
|---|---|---|---|
| Okor Nyasha L | -- | None Available | |
| Greene John | $175,000 | None Available | |
| Lewis Geneva M | -- | None Available | |
| Dipasquale Thomas J | -- | None Available | |
| Lewis Donnie | $193,605 | -- |
Source: Public Records
Mortgage History
| Date | Status | Borrower | Loan Amount |
|---|---|---|---|
| Previous Owner | Lewis Geneva M | $217,250 |
Source: Public Records
Tax History Compared to Growth
Tax History
| Year | Tax Paid | Tax Assessment Tax Assessment Total Assessment is a certain percentage of the fair market value that is determined by local assessors to be the total taxable value of land and additions on the property. | Land | Improvement |
|---|---|---|---|---|
| 2024 | $2,912 | $310,300 | $74,100 | $236,200 |
| 2023 | $8,924 | $310,300 | $74,100 | $236,200 |
| 2022 | $2,770 | $310,300 | $74,100 | $236,200 |
| 2021 | $2,770 | $310,300 | $74,100 | $236,200 |
| 2020 | $2,703 | $310,300 | $74,100 | $236,200 |
| 2019 | $7,050 | $310,300 | $74,100 | $236,200 |
| 2018 | $2,623 | $310,300 | $74,100 | $236,200 |
| 2017 | $7,948 | $310,300 | $74,100 | $236,200 |
| 2016 | $5,413 | $310,300 | $74,100 | $236,200 |
| 2015 | -- | $310,300 | $74,100 | $236,200 |
| 2014 | -- | $310,300 | $74,100 | $236,200 |
Source: Public Records
Map
Nearby Homes