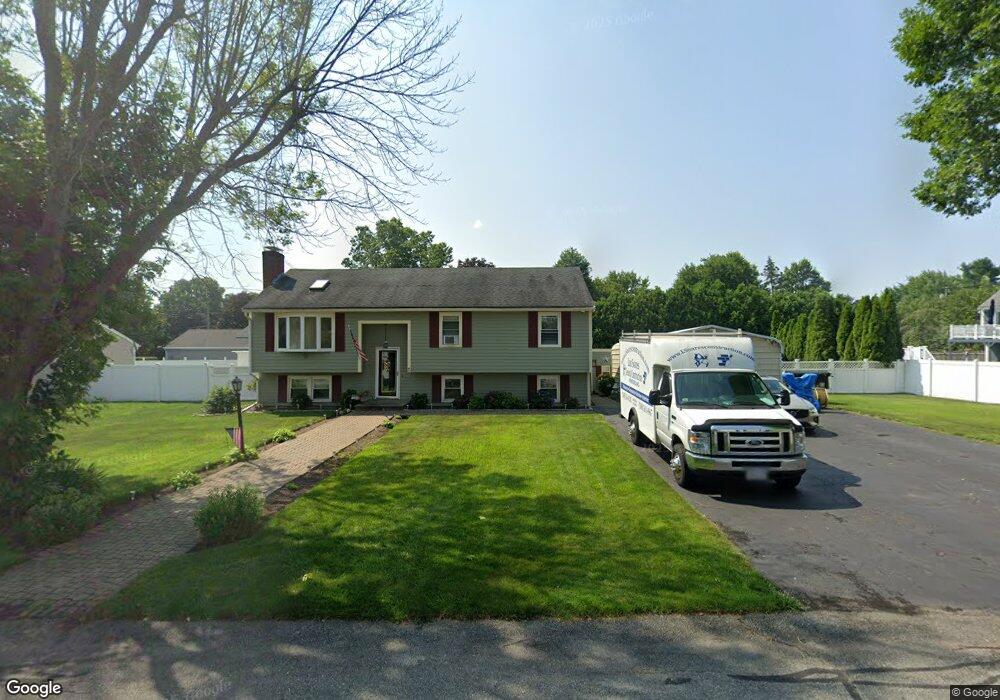
40 Colt Dr Seekonk, MA 02771
Estimated Value: $564,964 - $659,000
3
Beds
2
Baths
1,132
Sq Ft
$543/Sq Ft
Est. Value
About This Home
This home is located at 40 Colt Dr, Seekonk, MA 02771 and is currently estimated at $614,741, approximately $543 per square foot. 40 Colt Dr is a home located in Bristol County with nearby schools including Seekonk High School, St Mary Academy-Bay View, and Providence Country Day School.
Ownership History
Date
Name
Owned For
Owner Type
Purchase Details
Closed on
May 18, 2023
Sold by
Soares Luis C and Soares Susan M
Bought by
Soares Christina M and Soares Matthew L
Current Estimated Value
Purchase Details
Closed on
Mar 15, 1996
Sold by
Fnma
Bought by
Soares Luis C and Soares Susan M
Home Financials for this Owner
Home Financials are based on the most recent Mortgage that was taken out on this home.
Original Mortgage
$105,200
Interest Rate
6.97%
Mortgage Type
Purchase Money Mortgage
Purchase Details
Closed on
Feb 12, 1996
Sold by
Pimentel Manuel and Fnma
Bought by
Federal National Mortgage Association
Home Financials for this Owner
Home Financials are based on the most recent Mortgage that was taken out on this home.
Original Mortgage
$105,200
Interest Rate
6.97%
Mortgage Type
Purchase Money Mortgage
Create a Home Valuation Report for This Property
The Home Valuation Report is an in-depth analysis detailing your home's value as well as a comparison with similar homes in the area
Home Values in the Area
Average Home Value in this Area
Purchase History
| Date | Buyer | Sale Price | Title Company |
|---|---|---|---|
| Soares Christina M | -- | None Available | |
| Soares Luis C | $131,500 | -- | |
| Federal National Mortgage Association | $136,542 | -- |
Source: Public Records
Mortgage History
| Date | Status | Borrower | Loan Amount |
|---|---|---|---|
| Previous Owner | Federal National Mortgage Association | $20,000 | |
| Previous Owner | Federal National Mortgage Association | $14,178 | |
| Previous Owner | Federal National Mortgage Association | $105,200 |
Source: Public Records
Tax History Compared to Growth
Tax History
| Year | Tax Paid | Tax Assessment Tax Assessment Total Assessment is a certain percentage of the fair market value that is determined by local assessors to be the total taxable value of land and additions on the property. | Land | Improvement |
|---|---|---|---|---|
| 2025 | $5,632 | $456,000 | $156,400 | $299,600 |
| 2024 | $5,412 | $438,200 | $156,400 | $281,800 |
| 2023 | $5,285 | $403,100 | $140,300 | $262,800 |
| 2022 | $4,655 | $362,000 | $134,200 | $227,800 |
| 2021 | $4,655 | $343,000 | $118,900 | $224,100 |
| 2020 | $4,544 | $345,000 | $118,900 | $226,100 |
| 2019 | $4,399 | $336,800 | $118,900 | $217,900 |
| 2018 | $4,369 | $327,300 | $118,900 | $208,400 |
| 2017 | $4,222 | $313,700 | $113,800 | $199,900 |
| 2016 | $4,156 | $309,900 | $113,800 | $196,100 |
| 2015 | $4,050 | $306,100 | $113,800 | $192,300 |
Source: Public Records
Map
Nearby Homes