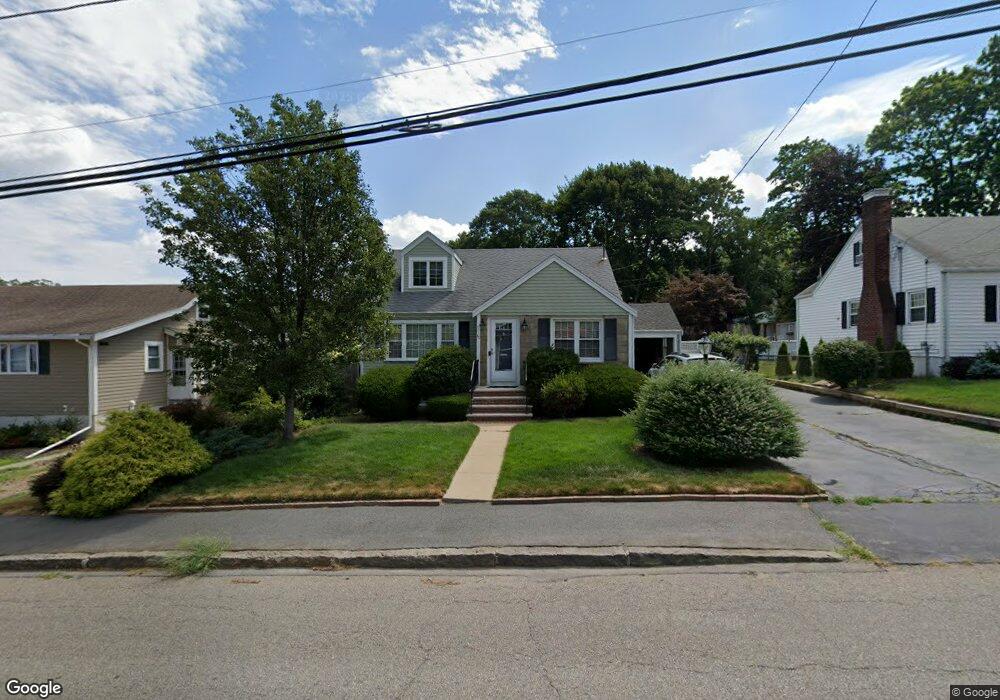
40 Common St Quincy, MA 02169
Quincy Center NeighborhoodEstimated Value: $743,000 - $800,985
3
Beds
2
Baths
1,711
Sq Ft
$448/Sq Ft
Est. Value
About This Home
This home is located at 40 Common St, Quincy, MA 02169 and is currently estimated at $766,746, approximately $448 per square foot. 40 Common St is a home located in Norfolk County with nearby schools including Charles A. Bernazzani Elementary School, Central Middle School, and Quincy High School.
Ownership History
Date
Name
Owned For
Owner Type
Purchase Details
Closed on
Jul 20, 2018
Sold by
Selbert Claire S
Bought by
Grachel Rt
Current Estimated Value
Purchase Details
Closed on
Sep 19, 2011
Sold by
Selbert Mark D and Selbert Claire S
Bought by
Selbert Claire S
Purchase Details
Closed on
Oct 25, 1996
Sold by
Defranco Michelle M and Defranco Alfred M
Bought by
Selbert Mark D and Selbert Claire S
Purchase Details
Closed on
Aug 21, 1992
Sold by
Griffin Daniel J and Griffin Josanne M
Bought by
Defranco Michelle M and Defranco Alfred M
Create a Home Valuation Report for This Property
The Home Valuation Report is an in-depth analysis detailing your home's value as well as a comparison with similar homes in the area
Home Values in the Area
Average Home Value in this Area
Purchase History
| Date | Buyer | Sale Price | Title Company |
|---|---|---|---|
| Grachel Rt | -- | -- | |
| Selbert Claire S | -- | -- | |
| Selbert Mark D | $182,600 | -- | |
| Defranco Michelle M | $165,000 | -- |
Source: Public Records
Mortgage History
| Date | Status | Borrower | Loan Amount |
|---|---|---|---|
| Previous Owner | Defranco Michelle M | $107,826 | |
| Previous Owner | Defranco Michelle M | $140,000 | |
| Previous Owner | Defranco Michelle M | $100,000 |
Source: Public Records
Tax History
| Year | Tax Paid | Tax Assessment Tax Assessment Total Assessment is a certain percentage of the fair market value that is determined by local assessors to be the total taxable value of land and additions on the property. | Land | Improvement |
|---|---|---|---|---|
| 2025 | $7,813 | $677,600 | $326,200 | $351,400 |
| 2024 | $7,437 | $659,900 | $311,400 | $348,500 |
| 2023 | $6,940 | $623,500 | $297,300 | $326,200 |
| 2022 | $6,016 | $502,200 | $240,600 | $261,600 |
| 2021 | $5,979 | $492,500 | $240,600 | $251,900 |
| 2020 | $5,995 | $482,300 | $240,600 | $241,700 |
| 2019 | $5,596 | $445,900 | $234,100 | $211,800 |
| 2018 | $5,529 | $414,500 | $217,800 | $196,700 |
| 2017 | $5,319 | $375,400 | $208,100 | $167,300 |
| 2016 | $4,976 | $346,500 | $190,500 | $156,000 |
| 2015 | $4,819 | $330,100 | $180,500 | $149,600 |
| 2014 | $4,575 | $307,900 | $180,500 | $127,400 |
Source: Public Records
Map
Nearby Homes
- 149 Reservoir Rd
- 39 Cross St
- 40 Cross St Unit 1
- 312 Adams St
- 230 Willard St Unit 102
- 230 Willard St Unit 207
- 211 Copeland St
- 580 Quarry St Unit 13
- 475 Beale St
- 41 Wallace Rd
- 165 Whitwell St
- 72 Oakland Ave
- 21 Arthur St
- 169 Pine St
- 84 West St Unit 1
- 17 Bunton St
- 17 Albany St
- 91 Garfield St
- 52 Packards Ln Unit 4
- 281 Elmwood Ave
Your Personal Tour Guide
Ask me questions while you tour the home.