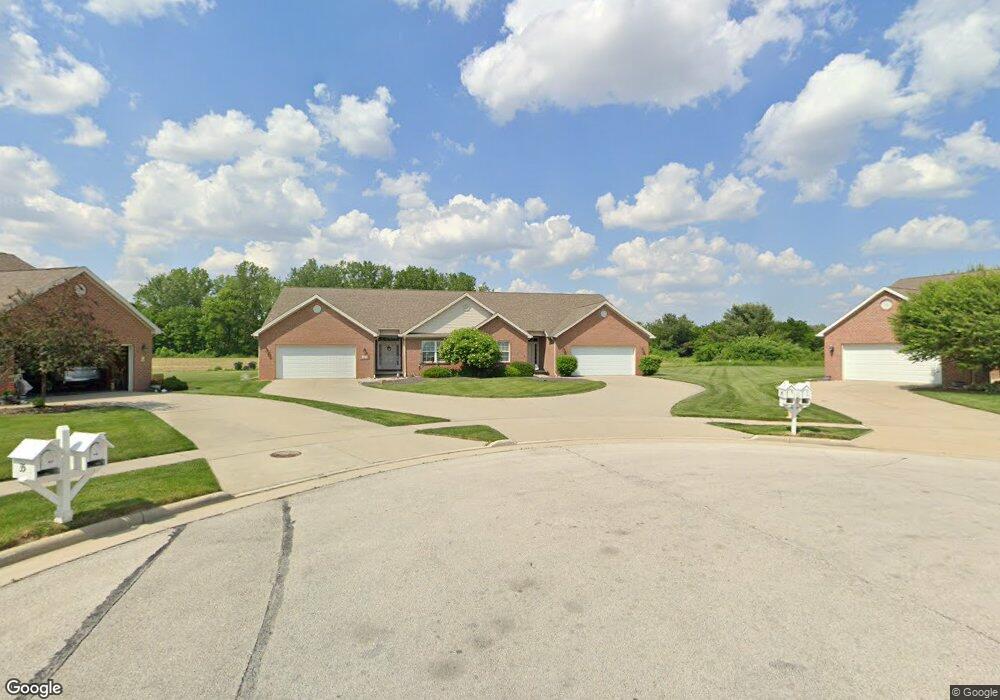
40 Crabtree Ct Swanton, OH 43558
Estimated Value: $281,021 - $326,000
2
Beds
2
Baths
1,700
Sq Ft
$183/Sq Ft
Est. Value
About This Home
This home is located at 40 Crabtree Ct, Swanton, OH 43558 and is currently estimated at $310,755, approximately $182 per square foot. 40 Crabtree Ct is a home located in Fulton County with nearby schools including Swanton High School, Swanton Middle School, and St. Richard School.
Ownership History
Date
Name
Owned For
Owner Type
Purchase Details
Closed on
Feb 8, 2022
Sold by
Kevin Thornton
Bought by
Trust Agreement Of Kevin F Tho
Current Estimated Value
Purchase Details
Closed on
Aug 10, 2012
Sold by
Thornton Kevin and Thornton Sherri I
Bought by
Thornton Kevin
Home Financials for this Owner
Home Financials are based on the most recent Mortgage that was taken out on this home.
Original Mortgage
$136,000
Interest Rate
3.54%
Mortgage Type
New Conventional
Purchase Details
Closed on
Aug 29, 2006
Sold by
Moyer Dean Ltd
Bought by
Thornton Kevin
Home Financials for this Owner
Home Financials are based on the most recent Mortgage that was taken out on this home.
Original Mortgage
$133,500
Interest Rate
6.88%
Mortgage Type
Purchase Money Mortgage
Purchase Details
Closed on
May 7, 2004
Sold by
Ashgreen Llc
Bought by
Moyer Dean Ltd
Create a Home Valuation Report for This Property
The Home Valuation Report is an in-depth analysis detailing your home's value as well as a comparison with similar homes in the area
Home Values in the Area
Average Home Value in this Area
Purchase History
| Date | Buyer | Sale Price | Title Company |
|---|---|---|---|
| Trust Agreement Of Kevin F Tho | -- | Mcquades Co Lpa | |
| Thornton Kevin | -- | None Available | |
| Thornton Kevin | $178,000 | None Available | |
| Moyer Dean Ltd | $60,000 | -- |
Source: Public Records
Mortgage History
| Date | Status | Borrower | Loan Amount |
|---|---|---|---|
| Previous Owner | Thornton Kevin | $136,000 | |
| Previous Owner | Thornton Kevin | $133,500 |
Source: Public Records
Tax History
| Year | Tax Paid | Tax Assessment Tax Assessment Total Assessment is a certain percentage of the fair market value that is determined by local assessors to be the total taxable value of land and additions on the property. | Land | Improvement |
|---|---|---|---|---|
| 2025 | $3,367 | $81,310 | $12,180 | $69,130 |
| 2024 | $3,367 | $81,310 | $12,180 | $69,130 |
| 2023 | $3,426 | $81,310 | $12,180 | $69,130 |
| 2022 | $2,793 | $59,540 | $10,150 | $49,390 |
| 2021 | $2,955 | $59,540 | $10,150 | $49,390 |
| 2020 | $2,920 | $59,540 | $10,150 | $49,390 |
| 2019 | $2,796 | $55,690 | $10,150 | $45,540 |
| 2018 | $2,650 | $55,690 | $10,150 | $45,540 |
| 2017 | $2,610 | $55,690 | $10,150 | $45,540 |
| 2016 | $2,621 | $50,120 | $10,150 | $39,970 |
| 2015 | $2,491 | $50,120 | $10,150 | $39,970 |
| 2014 | $2,521 | $50,120 | $10,150 | $39,970 |
| 2013 | $2,761 | $54,360 | $8,580 | $45,780 |
Source: Public Records
Map
Nearby Homes
- 21 Crabtree Ct
- 19 Crabtree Ct
- 0 Waterwood Dr
- 233 N Main St
- 227 Kierra Ln
- 208 Dodge St
- 105 Pennsylvania Ave
- 8335 County Road 3
- 7893 County Road 2
- 120 E Airport Hwy
- 7032 County Road 2
- 225 Kierra Ln
- 13620 Brindley Rd
- 4303 S Berkey Southern Rd
- 13135 Shaffer Rd
- 4800 County Road K
- 1709 Township Road Ef
- 1670 County Road Ef
- 0 County Road 1-2 Unit 10005759
- 3121 County Road Ef
Your Personal Tour Guide
Ask me questions while you tour the home.