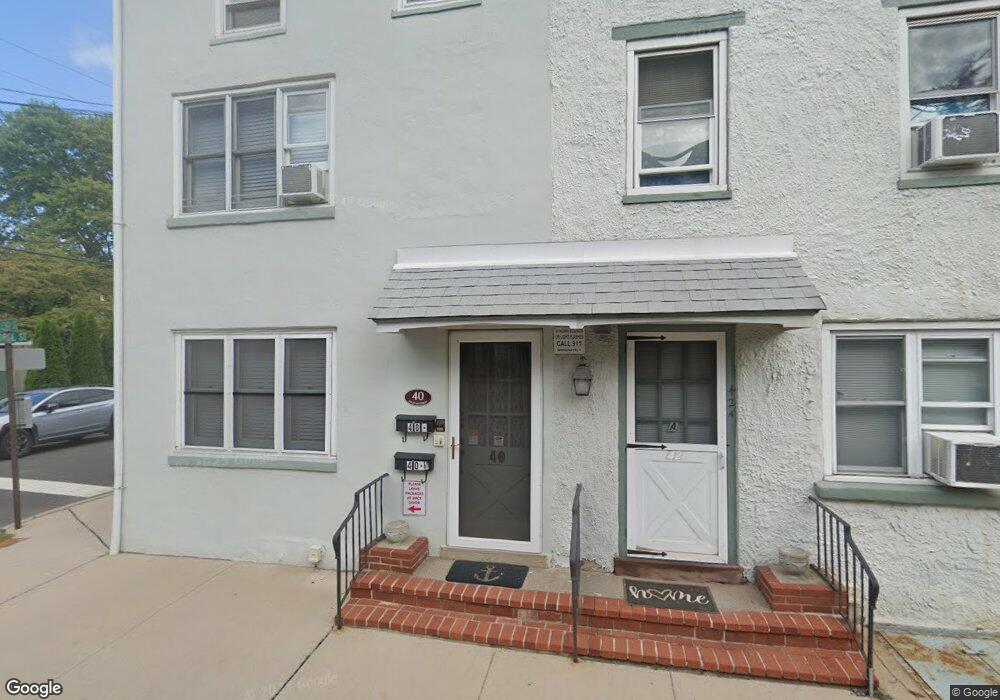
40 Delevan St Lambertville, NJ 08530
Estimated Value: $584,482 - $698,000
--
Bed
--
Bath
2,236
Sq Ft
$288/Sq Ft
Est. Value
About This Home
This home is located at 40 Delevan St, Lambertville, NJ 08530 and is currently estimated at $643,121, approximately $287 per square foot. 40 Delevan St is a home located in Hunterdon County with nearby schools including South Hunterdon Regional Elementary School, South Hunterdon High School, and The Jesus School.
Ownership History
Date
Name
Owned For
Owner Type
Purchase Details
Closed on
Nov 14, 2015
Sold by
Ireth Llc
Bought by
Nemeth Janice and The Janice Nemeth Living Trust
Current Estimated Value
Purchase Details
Closed on
Dec 21, 2006
Sold by
Ireth Llc
Bought by
Flannery S Marc
Purchase Details
Closed on
May 24, 2006
Sold by
Nemeth Jance E and Leonardi Irene C
Bought by
Ireth Llc
Purchase Details
Closed on
Oct 2, 2002
Sold by
Ireth Llc
Bought by
Nemeth Janice E and Leonardi Irene C
Home Financials for this Owner
Home Financials are based on the most recent Mortgage that was taken out on this home.
Original Mortgage
$90,300
Interest Rate
5.62%
Mortgage Type
Purchase Money Mortgage
Purchase Details
Closed on
Oct 30, 1992
Sold by
Schneiderman Mary Elizabeth
Bought by
Leonardi Irene C and Jan Nemeth
Purchase Details
Closed on
Aug 22, 1990
Sold by
Schneiderman Mary E and Schneiderman Pedrick R
Bought by
Schneiderman Mary E
Create a Home Valuation Report for This Property
The Home Valuation Report is an in-depth analysis detailing your home's value as well as a comparison with similar homes in the area
Home Values in the Area
Average Home Value in this Area
Purchase History
| Date | Buyer | Sale Price | Title Company |
|---|---|---|---|
| Nemeth Janice | -- | Attorney | |
| Flannery S Marc | $436,000 | Signature Title Services Inc | |
| Ireth Llc | -- | None Available | |
| Nemeth Janice E | -- | -- | |
| Leonardi Irene C | $155,000 | -- | |
| Schneiderman Mary E | -- | -- |
Source: Public Records
Mortgage History
| Date | Status | Borrower | Loan Amount |
|---|---|---|---|
| Previous Owner | Nemeth Janice E | $90,300 |
Source: Public Records
Tax History Compared to Growth
Tax History
| Year | Tax Paid | Tax Assessment Tax Assessment Total Assessment is a certain percentage of the fair market value that is determined by local assessors to be the total taxable value of land and additions on the property. | Land | Improvement |
|---|---|---|---|---|
| 2025 | $10,504 | $478,000 | $276,500 | $201,500 |
| 2024 | $10,136 | $454,500 | $256,500 | $198,000 |
| 2023 | $10,136 | $432,800 | $236,500 | $196,300 |
| 2022 | $9,767 | $422,800 | $226,500 | $196,300 |
| 2021 | $9,249 | $407,800 | $211,500 | $196,300 |
| 2020 | $8,880 | $399,800 | $203,500 | $196,300 |
| 2019 | $8,263 | $390,300 | $194,000 | $196,300 |
| 2018 | $8,127 | $389,800 | $193,500 | $196,300 |
| 2017 | $7,915 | $387,800 | $191,500 | $196,300 |
| 2016 | $7,660 | $382,800 | $186,500 | $196,300 |
| 2015 | $7,519 | $346,100 | $181,500 | $164,600 |
| 2014 | $6,898 | $346,100 | $181,500 | $164,600 |
Source: Public Records
Map
Nearby Homes
- 36 Delevan St
- 34 Delevan St
- 31 Jefferson St
- 27 Jefferson St
- 32 Delevan St
- 21 Jefferson St
- 50 Delevan St
- 30 Delevan St
- 17 Jefferson St
- 39 Delevan St
- 41 Delevan St
- 41 Delevan St Unit 1ST FL
- 43 Delevan St
- 52 Delevan St
- 33 Jefferson St
- 37 Delevan St
- 28 Delevan St
- 15 Jefferson St
- 45 Delevan St
- 35 Delevan St