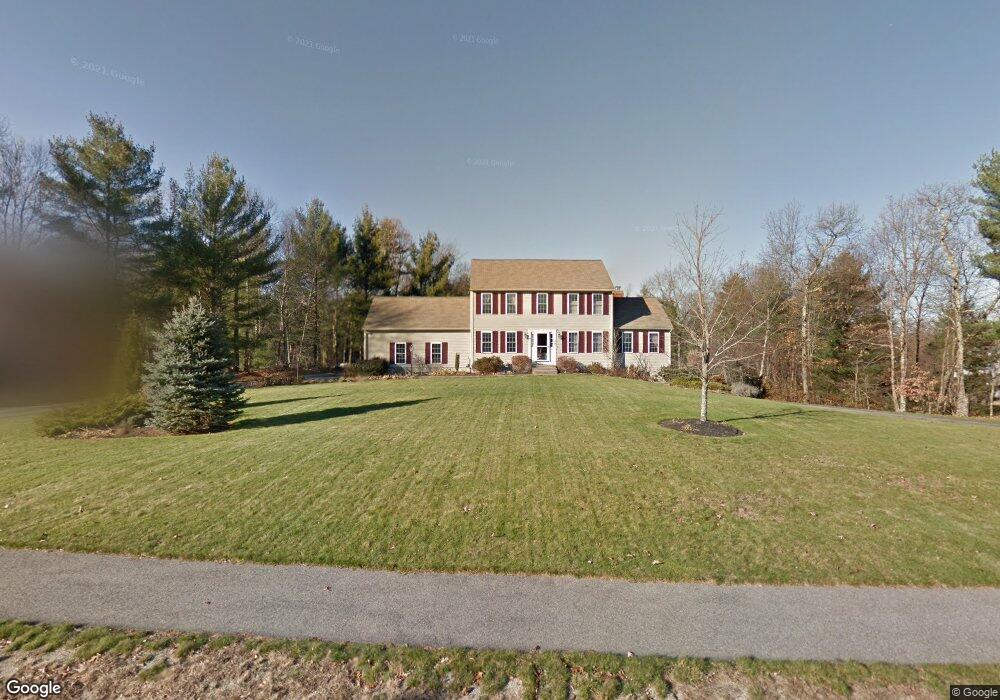
40 Downs Rd Douglas, MA 01516
Estimated Value: $635,571 - $678,000
3
Beds
4
Baths
1,844
Sq Ft
$355/Sq Ft
Est. Value
About This Home
This home is located at 40 Downs Rd, Douglas, MA 01516 and is currently estimated at $655,143, approximately $355 per square foot. 40 Downs Rd is a home located in Worcester County with nearby schools including Douglas Primary School, Douglas Middle School, and Douglas High School.
Ownership History
Date
Name
Owned For
Owner Type
Purchase Details
Closed on
Jul 25, 2013
Sold by
Sundeen Scott H and Sundeen Cheryl A
Bought by
Sundeen Jason C
Current Estimated Value
Home Financials for this Owner
Home Financials are based on the most recent Mortgage that was taken out on this home.
Original Mortgage
$225,000
Outstanding Balance
$162,365
Interest Rate
3.97%
Mortgage Type
New Conventional
Estimated Equity
$492,778
Purchase Details
Closed on
Sep 10, 1999
Sold by
Audet Bldrs Inc
Bought by
Sundeen Scott H and Sundeen Cheryl A
Home Financials for this Owner
Home Financials are based on the most recent Mortgage that was taken out on this home.
Original Mortgage
$150,000
Interest Rate
7.65%
Mortgage Type
Purchase Money Mortgage
Create a Home Valuation Report for This Property
The Home Valuation Report is an in-depth analysis detailing your home's value as well as a comparison with similar homes in the area
Home Values in the Area
Average Home Value in this Area
Purchase History
| Date | Buyer | Sale Price | Title Company |
|---|---|---|---|
| Sundeen Jason C | $300,000 | -- | |
| Sundeen Jason C | $300,000 | -- | |
| Sundeen Scott H | $213,975 | -- |
Source: Public Records
Mortgage History
| Date | Status | Borrower | Loan Amount |
|---|---|---|---|
| Open | Sundeen Jason C | $225,000 | |
| Closed | Sundeen Jason C | $225,000 | |
| Previous Owner | Sundeen Scott H | $30,000 | |
| Previous Owner | Sundeen Scott H | $150,000 |
Source: Public Records
Tax History
| Year | Tax Paid | Tax Assessment Tax Assessment Total Assessment is a certain percentage of the fair market value that is determined by local assessors to be the total taxable value of land and additions on the property. | Land | Improvement |
|---|---|---|---|---|
| 2025 | $78 | $590,200 | $134,700 | $455,500 |
| 2024 | $7,628 | $564,200 | $122,500 | $441,700 |
| 2023 | $7,497 | $522,100 | $122,500 | $399,600 |
| 2022 | $7,428 | $454,600 | $102,200 | $352,400 |
| 2021 | $7,335 | $438,700 | $97,300 | $341,400 |
| 2020 | $7,166 | $422,000 | $97,300 | $324,700 |
| 2019 | $6,988 | $399,300 | $97,300 | $302,000 |
| 2018 | $6,251 | $389,000 | $97,300 | $291,700 |
| 2017 | $6,108 | $365,300 | $102,100 | $263,200 |
| 2016 | $5,934 | $352,800 | $102,100 | $250,700 |
| 2015 | $5,807 | $352,800 | $102,100 | $250,700 |
Source: Public Records
Map
Nearby Homes
- 10 Essex St
- 11 Old Farm Rd
- 3 S East Main St
- 59 Old Farm Rd
- 48 Walnut St
- 240 South St
- 99 Maple St
- 41 Martin Rd
- Lot 27 Cedar St
- 279 S East Main St Unit Lot 2
- 32 Hemlock St
- 296 Yew St
- 38 Hemlock St
- 295 S East Main St Unit Lot 6
- 299 S East Main St Unit Lot 7
- 5 B St
- 303 S East Main St Unit Lot 8
- 307 S East Main St Unit Lot 9
- 1 White Ct
- 2 White Ct
Your Personal Tour Guide
Ask me questions while you tour the home.