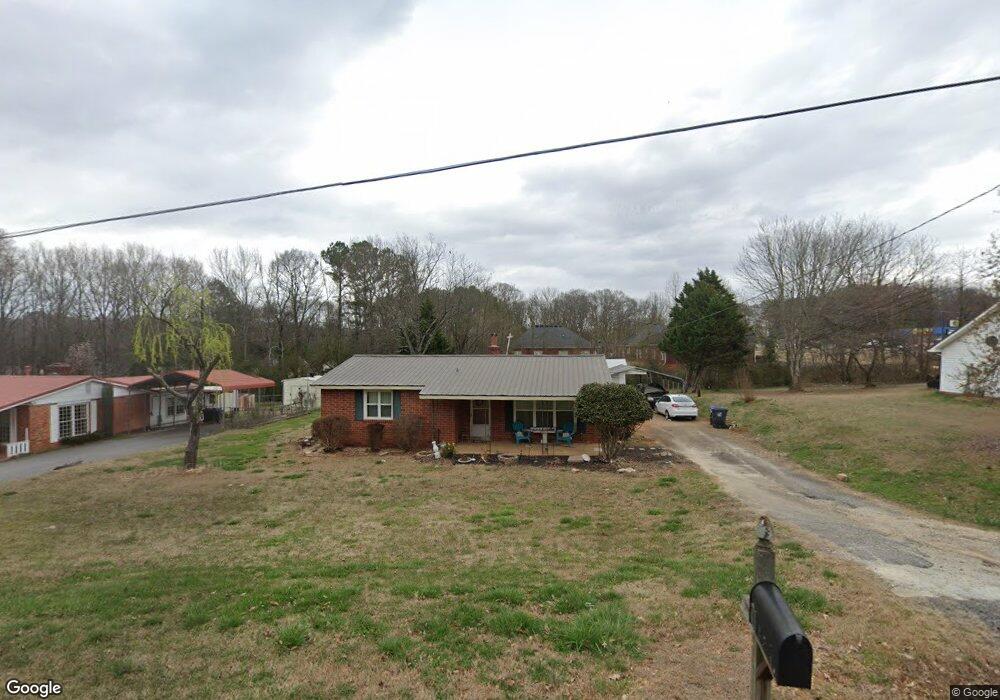
40 Duke St Jefferson, GA 30549
Estimated Value: $258,000 - $294,000
3
Beds
2
Baths
1,425
Sq Ft
$196/Sq Ft
Est. Value
About This Home
This home is located at 40 Duke St, Jefferson, GA 30549 and is currently estimated at $279,643, approximately $196 per square foot. 40 Duke St is a home located in Jackson County with nearby schools including Jefferson Elementary School, Jefferson Academy, and Jefferson Middle School.
Ownership History
Date
Name
Owned For
Owner Type
Purchase Details
Closed on
Jul 19, 2019
Sold by
Hollett Mary Elizabeth
Bought by
Lavender Blue Llc
Current Estimated Value
Purchase Details
Closed on
Mar 2, 2009
Sold by
Bank Of New York
Bought by
Hollett Robert B
Home Financials for this Owner
Home Financials are based on the most recent Mortgage that was taken out on this home.
Original Mortgage
$51,000
Interest Rate
5.14%
Mortgage Type
New Conventional
Purchase Details
Closed on
Jul 1, 2008
Sold by
Sheldon Karyn K
Bought by
The Bank Of New York
Purchase Details
Closed on
Mar 31, 2006
Sold by
Not Provided
Bought by
Hollett R Bruce and Hollett Mary Elizabeth
Home Financials for this Owner
Home Financials are based on the most recent Mortgage that was taken out on this home.
Original Mortgage
$95,120
Interest Rate
8.35%
Mortgage Type
New Conventional
Create a Home Valuation Report for This Property
The Home Valuation Report is an in-depth analysis detailing your home's value as well as a comparison with similar homes in the area
Home Values in the Area
Average Home Value in this Area
Purchase History
| Date | Buyer | Sale Price | Title Company |
|---|---|---|---|
| Lavender Blue Llc | -- | -- | |
| Hollett Robert B | $52,000 | -- | |
| The Bank Of New York | $100,421 | -- | |
| Hollett R Bruce | $118,900 | -- |
Source: Public Records
Mortgage History
| Date | Status | Borrower | Loan Amount |
|---|---|---|---|
| Previous Owner | Hollett Robert B | $51,000 | |
| Previous Owner | Hollett R Bruce | $95,120 |
Source: Public Records
Tax History Compared to Growth
Tax History
| Year | Tax Paid | Tax Assessment Tax Assessment Total Assessment is a certain percentage of the fair market value that is determined by local assessors to be the total taxable value of land and additions on the property. | Land | Improvement |
|---|---|---|---|---|
| 2024 | $1,461 | $53,240 | $8,280 | $44,960 |
| 2023 | $1,467 | $53,240 | $8,280 | $44,960 |
| 2022 | $1,299 | $40,400 | $4,960 | $35,440 |
| 2021 | $1,322 | $40,400 | $4,960 | $35,440 |
| 2020 | $1,181 | $33,720 | $4,960 | $28,760 |
| 2019 | $1,199 | $33,720 | $4,960 | $28,760 |
| 2018 | $1,190 | $33,200 | $4,960 | $28,240 |
| 2017 | $1,066 | $29,146 | $4,980 | $24,166 |
| 2016 | $1,071 | $29,146 | $4,980 | $24,166 |
| 2015 | $1,075 | $29,146 | $4,980 | $24,166 |
| 2014 | $1,057 | $28,378 | $4,980 | $23,398 |
| 2013 | -- | $28,378 | $4,980 | $23,398 |
Source: Public Records
Map
Nearby Homes
- 447 Oak Ave
- 0 Long Leaf Dr Unit 7665497
- 0 Long Leaf Dr Unit 7665504
- 0 Long Leaf Dr Unit 7665521
- 0 Long Leaf Dr Unit LOT 25
- 0 Long Leaf Dr Unit LOT 15
- 0 Long Leaf Dr Unit LOT 27
- 0 Long Leaf Dr Unit 7665559
- 0 Long Leaf Dr Unit LOT 28
- 0 Long Leaf Dr Unit 7665526
- 0 Long Leaf Dr Unit LOT 26
- 205 Chariot Ct
- 174 Chariot Ct
- 165 Chariot Ct
- 0 Brockton Loop Rd Unit Lot 1 and 2
- 0 Brockton Loop Rd
- 284 Oak St
- 131 Martin Luther King jr Dr
- 233 Red Dragon Dr
- 60 Duke St
- 20 Duke St
- 31 Hill Top Dr Unit BLDGS. 1 & 3
- 31 Hill Top Dr
- 33 Hill Top Dr
- 78 Duke St
- 45 Hill Top Dr Unit 45/43
- 45 Hill Top Dr
- 43 Hill Top Dr
- 53 Hill Top Dr Unit 1
- 53 Hill Top Dr
- 57 Duke St
- 67 Hill Top Dr
- 167 Lee St
- 167 Lee St Unit Bld.2
- 96 Duke St
- 77 Duke St
- 879 Lee St
- 89 Hill Top Dr
- 891 Lee St