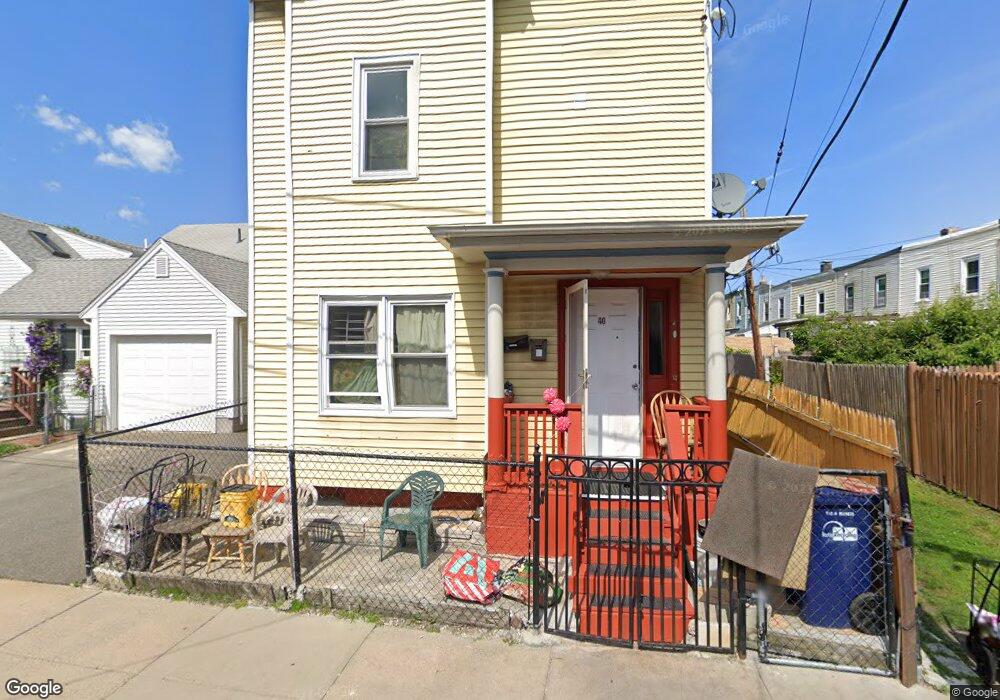
40 Duncan St Dorchester, MA 02122
Fields Corner East NeighborhoodEstimated Value: $570,975 - $738,000
4
Beds
2
Baths
1,458
Sq Ft
$425/Sq Ft
Est. Value
About This Home
This home is located at 40 Duncan St, Dorchester, MA 02122 and is currently estimated at $619,744, approximately $425 per square foot. 40 Duncan St is a home located in Suffolk County with nearby schools including UP Academy Charter School of Dorchester, Neighborhood House Charter School, and Helen Y. Davis Leadership Academy Charter Public School.
Ownership History
Date
Name
Owned For
Owner Type
Purchase Details
Closed on
Apr 4, 2023
Sold by
Ha Be T
Bought by
Be Thi Ha Lt and Ha
Current Estimated Value
Purchase Details
Closed on
Sep 20, 2004
Sold by
Chambliss Brenda and Taiste Sam
Bought by
Ha Be T
Home Financials for this Owner
Home Financials are based on the most recent Mortgage that was taken out on this home.
Original Mortgage
$223,200
Interest Rate
6.02%
Mortgage Type
Purchase Money Mortgage
Purchase Details
Closed on
Sep 30, 1996
Sold by
40 Duncan St Rt and Cawley
Bought by
Taiste Sam
Purchase Details
Closed on
May 21, 1996
Sold by
Duncan St Nt 40 and Frattalone
Bought by
Cawley Richard
Purchase Details
Closed on
Aug 28, 1995
Sold by
Bankers Trust Co and Frattalone
Bought by
Duncan Street Nt 40 and Frattalone
Purchase Details
Closed on
Mar 7, 1995
Sold by
Vutale Anthony B and Bankers Trust Co
Bought by
Bankers Trust Co
Create a Home Valuation Report for This Property
The Home Valuation Report is an in-depth analysis detailing your home's value as well as a comparison with similar homes in the area
Home Values in the Area
Average Home Value in this Area
Purchase History
| Date | Buyer | Sale Price | Title Company |
|---|---|---|---|
| Be Thi Ha Lt | -- | None Available | |
| Ha Be T | $279,000 | -- | |
| Taiste Sam | $110,000 | -- | |
| Cawley Richard | $65,000 | -- | |
| Duncan Street Nt 40 | $40,000 | -- | |
| Bankers Trust Co | $81,270 | -- |
Source: Public Records
Mortgage History
| Date | Status | Borrower | Loan Amount |
|---|---|---|---|
| Previous Owner | Bankers Trust Co | $223,200 | |
| Previous Owner | Bankers Trust Co | $107,297 |
Source: Public Records
Tax History
| Year | Tax Paid | Tax Assessment Tax Assessment Total Assessment is a certain percentage of the fair market value that is determined by local assessors to be the total taxable value of land and additions on the property. | Land | Improvement |
|---|---|---|---|---|
| 2025 | $5,431 | $469,000 | $131,800 | $337,200 |
| 2024 | $4,558 | $418,200 | $141,800 | $276,400 |
| 2023 | $4,121 | $383,700 | $130,100 | $253,600 |
| 2022 | $3,795 | $348,800 | $118,300 | $230,500 |
| 2021 | $3,446 | $323,000 | $109,500 | $213,500 |
| 2020 | $3,398 | $321,800 | $95,000 | $226,800 |
| 2019 | $3,084 | $292,600 | $74,900 | $217,700 |
| 2018 | $2,737 | $261,200 | $74,900 | $186,300 |
| 2017 | $2,686 | $253,600 | $74,900 | $178,700 |
| 2016 | $2,790 | $253,600 | $74,900 | $178,700 |
| 2015 | $2,209 | $182,400 | $65,600 | $116,800 |
| 2014 | $2,049 | $162,900 | $65,600 | $97,300 |
Source: Public Records
Map
Nearby Homes
- 74 Leonard St
- 30 Park St Unit 4
- 6 Ashland St Unit 2
- 9 Park St Unit 3
- 60 Gibson St Unit B1
- 13 Mill St Unit 1
- 32 Gibson St Unit 3
- 353-357 Adams St Unit L
- 65 Ridgewood St
- 68 Draper St
- 382 Adams St Unit 384-1
- 96 Dix St Unit 2
- 44 Mill St Unit 3
- 33 Adams St Unit 1
- 67 Church St Unit 1
- 29 Mount Ida Rd
- 20 Potosi St
- 98 Topliff St
- 110 Melville Ave Unit 1
- 113 Dakota St
- 37 Granger St
- 39 Granger St Unit 41
- 39 Granger St Unit 39
- 44 Leonard St
- 46 Leonard St
- 42 Leonard St
- 42 Leonard St Unit 2
- 48 Leonard St
- 50 Leonard St
- 43 Granger St
- 52 Leonard St
- 35 Duncan St
- 38 Leonard St
- 54 Leonard St
- 56 Leonard St
- 40 Granger St
- 3 Duncan Terrace
- 31 Duncan St Unit 1
- 31 Duncan St
- 31 Duncan St Unit 2
Your Personal Tour Guide
Ask me questions while you tour the home.