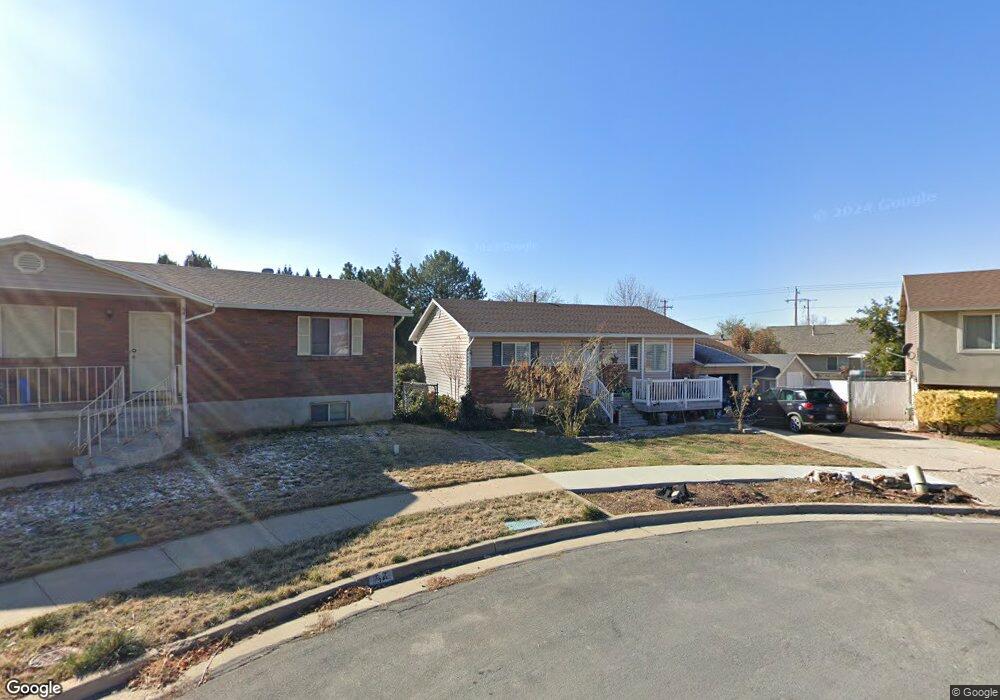
40 E 1950 S Clearfield, UT 84015
Estimated Value: $437,000 - $505,000
5
Beds
2
Baths
1,976
Sq Ft
$233/Sq Ft
Est. Value
About This Home
This home is located at 40 E 1950 S, Clearfield, UT 84015 and is currently estimated at $460,498, approximately $233 per square foot. 40 E 1950 S is a home located in Davis County with nearby schools including Antelope Elementary School, North Davis Junior High School, and Clearfield High School.
Ownership History
Date
Name
Owned For
Owner Type
Purchase Details
Closed on
Jun 25, 2024
Sold by
Utah Real Estate Buyers Llc
Bought by
Hyer Mckay Steffensen and Hyer Kent Thomas
Current Estimated Value
Home Financials for this Owner
Home Financials are based on the most recent Mortgage that was taken out on this home.
Original Mortgage
$436,939
Outstanding Balance
$430,666
Interest Rate
7.09%
Mortgage Type
FHA
Estimated Equity
$29,832
Purchase Details
Closed on
Mar 19, 2024
Sold by
Cooley Sally G
Bought by
Utah Real Estate Buyers Llc
Home Financials for this Owner
Home Financials are based on the most recent Mortgage that was taken out on this home.
Original Mortgage
$80,000
Interest Rate
6.64%
Mortgage Type
Seller Take Back
Create a Home Valuation Report for This Property
The Home Valuation Report is an in-depth analysis detailing your home's value as well as a comparison with similar homes in the area
Home Values in the Area
Average Home Value in this Area
Purchase History
| Date | Buyer | Sale Price | Title Company |
|---|---|---|---|
| Hyer Mckay Steffensen | -- | Stewart Title | |
| Utah Real Estate Buyers Llc | -- | Stewart Title |
Source: Public Records
Mortgage History
| Date | Status | Borrower | Loan Amount |
|---|---|---|---|
| Open | Hyer Mckay Steffensen | $436,939 | |
| Previous Owner | Utah Real Estate Buyers Llc | $80,000 | |
| Previous Owner | Utah Real Estate Buyers Llc | $200,000 |
Source: Public Records
Tax History
| Year | Tax Paid | Tax Assessment Tax Assessment Total Assessment is a certain percentage of the fair market value that is determined by local assessors to be the total taxable value of land and additions on the property. | Land | Improvement |
|---|---|---|---|---|
| 2025 | $2,878 | $257,950 | $70,386 | $187,564 |
| 2024 | $2,285 | $206,249 | $67,330 | $138,919 |
| 2023 | $2,106 | $349,000 | $108,283 | $240,717 |
| 2022 | $2,228 | $199,650 | $62,539 | $137,111 |
| 2021 | $1,979 | $268,000 | $63,761 | $204,239 |
| 2020 | $1,718 | $231,000 | $53,130 | $177,870 |
| 2019 | $1,657 | $220,000 | $57,519 | $162,481 |
| 2018 | $1,531 | $198,000 | $51,054 | $146,946 |
| 2016 | $1,221 | $82,555 | $20,213 | $62,342 |
| 2015 | $1,176 | $75,790 | $20,213 | $55,577 |
| 2014 | $1,158 | $75,661 | $20,213 | $55,448 |
| 2013 | -- | $63,816 | $26,304 | $37,512 |
Source: Public Records
Map
Nearby Homes
- 2345 S Main St
- 195 E 2325 S
- 369 W 1900 S
- 1685 S 245 W
- 1250 N 2925 W
- 2480 S Main St
- 460 E 1700 S Unit 1 & 2
- 1969 S 575 E
- 3250 W 1075 N
- 1877 S 725 E
- 3389 W Gordon Ave
- 906 E Sam Cir
- 1186 N 2425 W
- 907 W 1840 S Unit C
- 929 W 1920 S Unit A
- 961 1910 S
- 816 N 2700 W
- 1553 S 900 W
- 1553 S 900 W Unit 139
- 1547 S 900 W
Your Personal Tour Guide
Ask me questions while you tour the home.