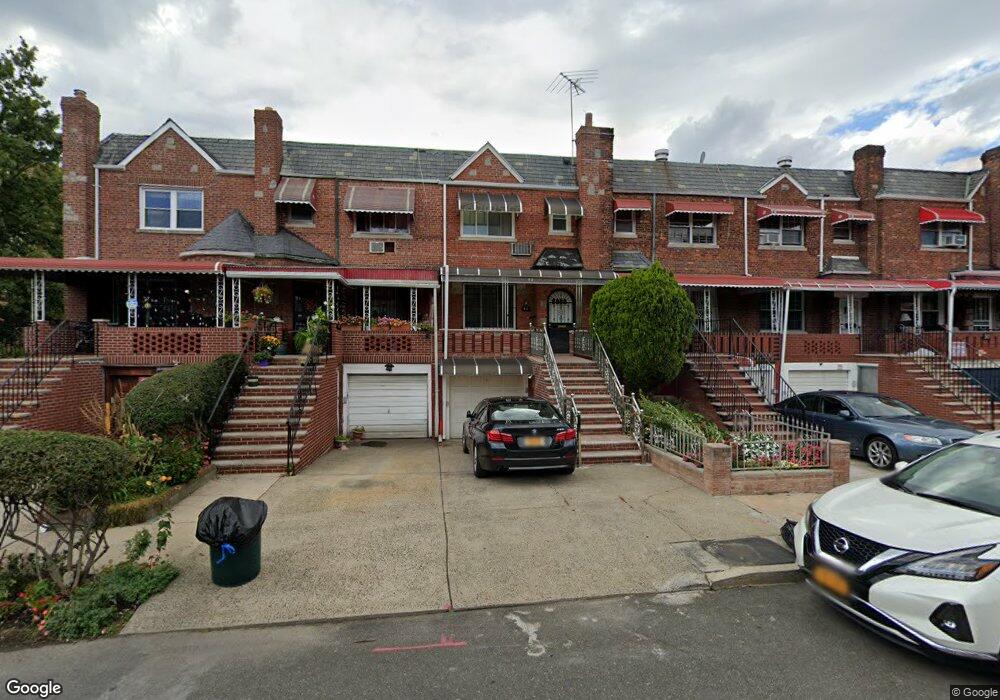
40 E 58th St Brooklyn, NY 11203
East Flatbush NeighborhoodEstimated Value: $729,000 - $851,000
Studio
--
Bath
2,038
Sq Ft
$390/Sq Ft
Est. Value
About This Home
This home is located at 40 E 58th St, Brooklyn, NY 11203 and is currently estimated at $795,633, approximately $390 per square foot. 40 E 58th St is a home located in Kings County with nearby schools including P.S. 268 Emma Lazarus, East Flatbush Community Research School, and Kings Elementary School.
Ownership History
Date
Name
Owned For
Owner Type
Purchase Details
Closed on
Jun 24, 2020
Sold by
Macklin Juliette and Nichols Erskine A
Bought by
Juliette Macklin Protective Trust Dtd 06 and Macklin, Juliette Ttee
Current Estimated Value
Purchase Details
Closed on
Mar 4, 2015
Sold by
I & J Partners Llc
Bought by
Macklin Juliette and Nichols Erskine A
Purchase Details
Closed on
Sep 8, 2014
Sold by
Albert S Robinson As Sole Surviving Heir
Bought by
I & J Partners Llc
Create a Home Valuation Report for This Property
The Home Valuation Report is an in-depth analysis detailing your home's value as well as a comparison with similar homes in the area
Home Values in the Area
Average Home Value in this Area
Purchase History
| Date | Buyer | Sale Price | Title Company |
|---|---|---|---|
| Juliette Macklin Protective Trust Dtd 06 | -- | -- | |
| Macklin Juliette | $440,000 | -- | |
| I & J Partners Llc | $205,000 | -- |
Source: Public Records
Tax History
| Year | Tax Paid | Tax Assessment Tax Assessment Total Assessment is a certain percentage of the fair market value that is determined by local assessors to be the total taxable value of land and additions on the property. | Land | Improvement |
|---|---|---|---|---|
| 2025 | $6,456 | $47,940 | $15,420 | $32,520 |
| 2024 | $6,456 | $46,200 | $15,420 | $30,780 |
| 2023 | $6,367 | $46,140 | $15,420 | $30,720 |
| 2022 | $3,908 | $40,800 | $15,420 | $25,380 |
| 2021 | $5,881 | $41,160 | $15,420 | $25,740 |
| 2020 | $648 | $36,900 | $15,420 | $21,480 |
| 2019 | $5,603 | $36,900 | $15,420 | $21,480 |
| 2018 | $5,465 | $26,126 | $12,987 | $13,139 |
| 2016 | $4,655 | $23,288 | $13,541 | $9,747 |
| 2015 | $2,586 | $22,320 | $15,060 | $7,260 |
| 2014 | $2,586 | $22,320 | $15,060 | $7,260 |
Source: Public Records
Map
Nearby Homes
- 891 Linden Blvd
- 980 Lenox Rd
- 890 Linden Blvd
- 886 Linden Blvd Unit 888
- 871 Linden Blvd
- 175 E 55th St
- 27 E 56th St
- 336 E 91st St Unit 4
- 179 E 54th St
- 895 Lenox Rd
- 323 E 91st St
- 1040 Willmohr St
- 5749 Kings Hwy
- 234 E 54th St
- 91 E 54th St Unit 2-R
- 227 E 56th St
- 5319 Church Ave
- 206 E 53rd St
- 5727 Kings Hwy
- 26 E 55th St
Your Personal Tour Guide
Ask me questions while you tour the home.