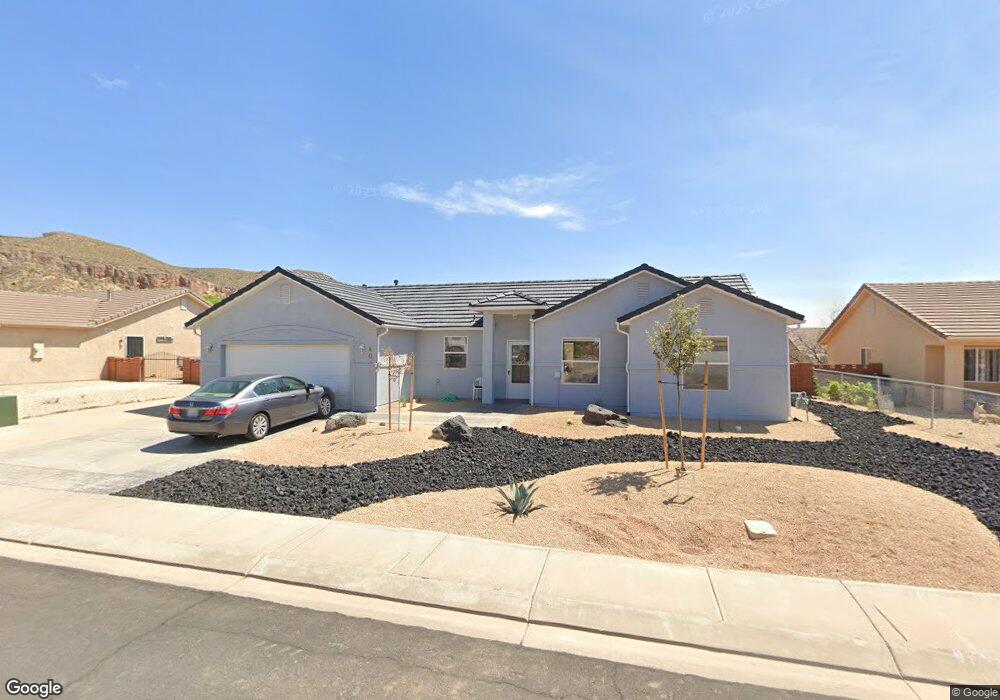
40 E 645 N La Verkin, UT 84745
Estimated Value: $394,000 - $403,437
4
Beds
2
Baths
1,400
Sq Ft
$285/Sq Ft
Est. Value
About This Home
This home is located at 40 E 645 N, La Verkin, UT 84745 and is currently estimated at $398,359, approximately $284 per square foot. 40 E 645 N is a home located in Washington County with nearby schools including La Verkin Elementary School, Hurricane Middle School, and Hurricane High School.
Ownership History
Date
Name
Owned For
Owner Type
Purchase Details
Closed on
Nov 4, 2025
Sold by
Loader Melvin Earlay and Loader Irene I
Bought by
Olds Ryan T
Current Estimated Value
Home Financials for this Owner
Home Financials are based on the most recent Mortgage that was taken out on this home.
Original Mortgage
$15,500
Outstanding Balance
$15,500
Interest Rate
6.3%
Estimated Equity
$382,859
Purchase Details
Closed on
Feb 28, 2005
Sold by
Brindley Howard N
Bought by
Loader Melvin Earlay and Loader Irene I
Create a Home Valuation Report for This Property
The Home Valuation Report is an in-depth analysis detailing your home's value as well as a comparison with similar homes in the area
Home Values in the Area
Average Home Value in this Area
Purchase History
| Date | Buyer | Sale Price | Title Company |
|---|---|---|---|
| Olds Ryan T | -- | Metro National Title | |
| Loader Melvin Earlay | -- | Terra Title Co |
Source: Public Records
Mortgage History
| Date | Status | Borrower | Loan Amount |
|---|---|---|---|
| Open | Olds Ryan T | $15,500 | |
| Open | Olds Ryan T | $392,755 |
Source: Public Records
Tax History
| Year | Tax Paid | Tax Assessment Tax Assessment Total Assessment is a certain percentage of the fair market value that is determined by local assessors to be the total taxable value of land and additions on the property. | Land | Improvement |
|---|---|---|---|---|
| 2025 | $1,615 | $226,105 | $59,400 | $166,705 |
| 2023 | $1,282 | $170,005 | $51,975 | $118,030 |
| 2022 | $1,499 | $187,110 | $41,250 | $145,860 |
| 2021 | $1,579 | $290,100 | $65,000 | $225,100 |
| 2020 | $1,413 | $242,800 | $50,000 | $192,800 |
| 2019 | $1,264 | $208,200 | $40,000 | $168,200 |
| 2018 | $1,283 | $104,170 | $0 | $0 |
| 2017 | $1,173 | $95,150 | $0 | $0 |
| 2016 | $1,093 | $85,085 | $0 | $0 |
| 2015 | $1,078 | $80,630 | $0 | $0 |
| 2014 | $971 | $71,665 | $0 | $0 |
Source: Public Records
Map
Nearby Homes
Your Personal Tour Guide
Ask me questions while you tour the home.