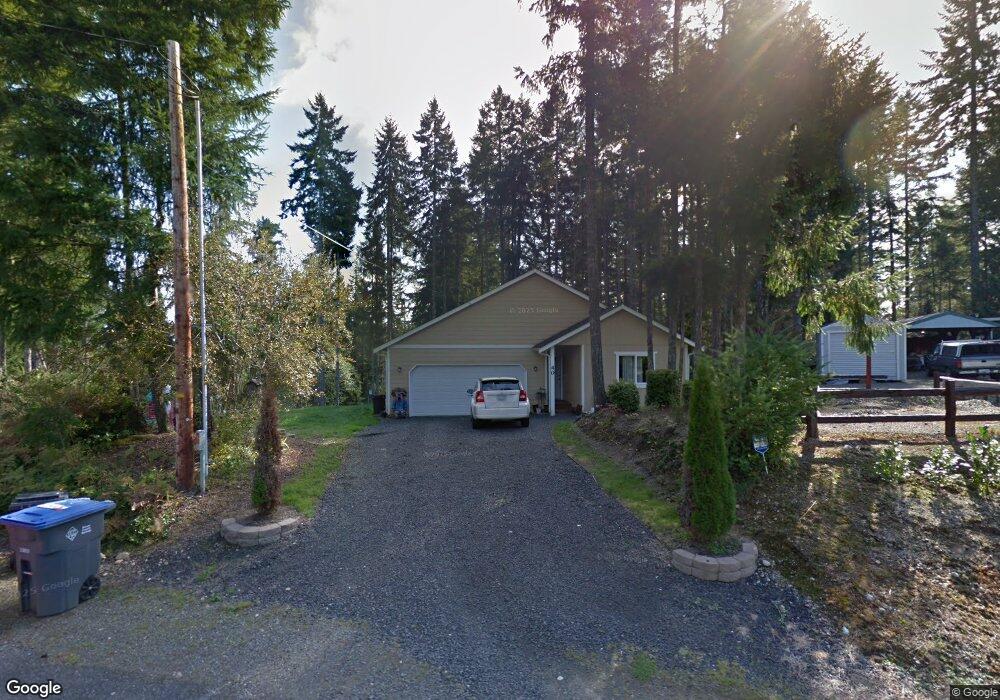
40 E Angus Ct Shelton, WA 98584
Estimated Value: $343,000 - $418,000
3
Beds
2
Baths
1,328
Sq Ft
$287/Sq Ft
Est. Value
About This Home
This home is located at 40 E Angus Ct, Shelton, WA 98584 and is currently estimated at $381,696, approximately $287 per square foot. 40 E Angus Ct is a home located in Mason County with nearby schools including Pioneer Primary School and Pioneer Intermediate/Middle School.
Ownership History
Date
Name
Owned For
Owner Type
Purchase Details
Closed on
Nov 24, 2010
Sold by
Vanvanslyke Brett Van and Slyke Juanita Van
Bought by
Hocker April L
Current Estimated Value
Home Financials for this Owner
Home Financials are based on the most recent Mortgage that was taken out on this home.
Original Mortgage
$160,621
Outstanding Balance
$105,018
Interest Rate
4.17%
Mortgage Type
New Conventional
Estimated Equity
$276,678
Purchase Details
Closed on
Oct 15, 2008
Sold by
B & G Properties Inc
Bought by
Vanslyke Brett
Purchase Details
Closed on
Jun 20, 2007
Sold by
Vanslyke D E and Van Slyke Barbara D
Bought by
B & G Properties Inc
Home Financials for this Owner
Home Financials are based on the most recent Mortgage that was taken out on this home.
Original Mortgage
$160,000
Interest Rate
6.21%
Mortgage Type
Purchase Money Mortgage
Purchase Details
Closed on
May 30, 2006
Sold by
The Huff Family Trust
Bought by
Vanslyke D E and Van Slyke Barbara D
Create a Home Valuation Report for This Property
The Home Valuation Report is an in-depth analysis detailing your home's value as well as a comparison with similar homes in the area
Purchase History
| Date | Buyer | Sale Price | Title Company |
|---|---|---|---|
| Hocker April L | $155,000 | Mason County Title Ins Co | |
| Vanslyke Brett | -- | First American Title | |
| B & G Properties Inc | $37,000 | First American Title | |
| Vanslyke D E | $29,900 | First American Title |
Source: Public Records
Mortgage History
| Date | Status | Borrower | Loan Amount |
|---|---|---|---|
| Open | Hocker April L | $160,621 | |
| Previous Owner | B & G Properties Inc | $160,000 |
Source: Public Records
Tax History
| Year | Tax Paid | Tax Assessment Tax Assessment Total Assessment is a certain percentage of the fair market value that is determined by local assessors to be the total taxable value of land and additions on the property. | Land | Improvement |
|---|---|---|---|---|
| 2025 | $2,937 | $318,350 | $42,775 | $275,575 |
| 2023 | $2,937 | $364,865 | $22,405 | $342,460 |
| 2022 | $2,803 | $283,780 | $24,090 | $259,690 |
| 2021 | $2,666 | $283,780 | $24,090 | $259,690 |
| 2020 | $2,336 | $248,755 | $20,075 | $228,680 |
| 2018 | $1,962 | $166,720 | $18,000 | $148,720 |
| 2017 | $1,662 | $166,720 | $18,000 | $148,720 |
| 2016 | $1,664 | $145,140 | $15,750 | $129,390 |
| 2015 | $1,434 | $145,140 | $15,750 | $129,390 |
| 2014 | -- | $138,295 | $15,000 | $123,295 |
| 2013 | -- | $123,045 | $15,000 | $108,045 |
Source: Public Records
Map
Nearby Homes
- 101 E Errigal Place
- 60 E Balbriggan Rd
- 71 E Dunvegan Rd
- 310 E Olde Lyme Rd
- 560 E Dartmoor Dr Unit 138
- 0 E Olde Lyme Rd
- 424 E Olde Lyme Rd
- 160 E Barnsby Place
- 100 E Kilmarnock Rd
- 821 E Olde Lyme Rd
- 220 E Peebles Ct
- 501 E Saint Andrews Dr
- 281 E Road of Tralee
- 280 E Clonakilty Dr
- 1030 E Saint Andrews Dr
- 651 E Ballantrae Dr
- 120 E Shannon Place
- 111 E Maryann Place
- 31 E Tintagel Place
- 30 E Glenmorgan Ct
- 50 E Angus Ct
- 41 E Errigal Place
- 61 E Errigal Place
- 91 E Errigal Place
- 60 E Angus Ct
- 21 E Errigal Place
- 81 E Errigal Place
- 0 E Errigal Place
- 240 E Balbriggan Rd
- 51 E Angus Ct
- 150 E Balbriggan Rd
- 60 E Errigal Place
- 330 E Balbriggan Rd
- 350 E Balbriggan Rd
- 201 E Balbriggan Rd
- 211 E Balbriggan Rd
- 140 E Balbriggan Rd
- 171 E Balbriggan Rd
- 231 E Balbriggan Rd
Your Personal Tour Guide
Ask me questions while you tour the home.