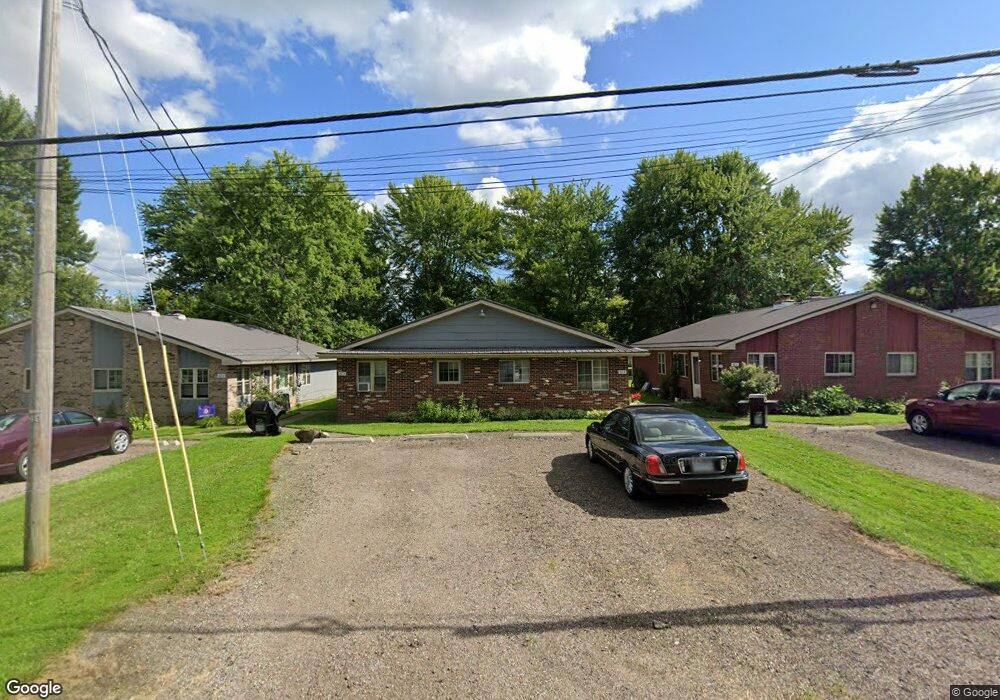
40 E Fir St Unit A New London, OH 44851
Estimated Value: $65,000 - $638,000
4
Beds
2
Baths
1,620
Sq Ft
$168/Sq Ft
Est. Value
About This Home
This home is located at 40 E Fir St Unit A, New London, OH 44851 and is currently estimated at $271,667, approximately $167 per square foot. 40 E Fir St Unit A is a home located in Huron County with nearby schools including New London Elementary School, New London Middle School, and New London High School.
Ownership History
Date
Name
Owned For
Owner Type
Purchase Details
Closed on
Aug 20, 2018
Sold by
Danison Jill R and Iceman David C
Bought by
Marnick Properties Llc
Current Estimated Value
Home Financials for this Owner
Home Financials are based on the most recent Mortgage that was taken out on this home.
Original Mortgage
$216,900
Outstanding Balance
$188,369
Interest Rate
4.5%
Mortgage Type
Credit Line Revolving
Estimated Equity
$83,298
Purchase Details
Closed on
Aug 24, 2007
Bought by
Danison Jill R and Iceman Or David C
Purchase Details
Closed on
Jan 31, 2007
Bought by
Mcmann Limited
Purchase Details
Closed on
Jul 17, 2001
Bought by
Seminary Limited
Purchase Details
Closed on
Dec 10, 1999
Bought by
Seminary Limited
Purchase Details
Closed on
Aug 31, 1999
Sold by
Korinko John T
Bought by
Gerber Carl L
Purchase Details
Closed on
Jan 15, 1982
Bought by
Gmtw Partners
Create a Home Valuation Report for This Property
The Home Valuation Report is an in-depth analysis detailing your home's value as well as a comparison with similar homes in the area
Home Values in the Area
Average Home Value in this Area
Purchase History
| Date | Buyer | Sale Price | Title Company |
|---|---|---|---|
| Marnick Properties Llc | $290,000 | None Available | |
| Danison Jill R | $62,000 | -- | |
| Mcmann Limited | -- | -- | |
| Seminary Limited | -- | -- | |
| Seminary Limited | -- | -- | |
| Gerber Carl L | $258,400 | -- | |
| Gmtw Partners | $104,500 | -- |
Source: Public Records
Mortgage History
| Date | Status | Borrower | Loan Amount |
|---|---|---|---|
| Open | Marnick Properties Llc | $216,900 |
Source: Public Records
Tax History Compared to Growth
Tax History
| Year | Tax Paid | Tax Assessment Tax Assessment Total Assessment is a certain percentage of the fair market value that is determined by local assessors to be the total taxable value of land and additions on the property. | Land | Improvement |
|---|---|---|---|---|
| 2024 | $1,083 | $29,230 | $2,920 | $26,310 |
| 2023 | $1,083 | $20,760 | $2,470 | $18,290 |
| 2022 | $744 | $20,760 | $2,470 | $18,290 |
| 2021 | $744 | $20,760 | $2,470 | $18,290 |
| 2020 | $791 | $20,570 | $1,940 | $18,630 |
| 2019 | $787 | $20,570 | $1,940 | $18,630 |
| 2018 | $769 | $20,570 | $1,940 | $18,630 |
| 2017 | $823 | $23,690 | $1,940 | $21,750 |
| 2016 | $810 | $23,690 | $1,940 | $21,750 |
| 2015 | $809 | $23,710 | $1,950 | $21,760 |
| 2014 | $825 | $23,700 | $1,960 | $21,740 |
| 2013 | $819 | $23,700 | $1,960 | $21,740 |
Source: Public Records
Map
Nearby Homes
- 21 Cedar St
- 152 N Main St Unit 2
- 41 N Railroad St
- 0 Section Line Rd Unit 20253852
- 155 E Main St
- 159 E Main St
- 115 W Main St
- 34 Park Ave
- 201 E Main St
- 99 S Main St
- 109 Clifton St
- 128 1st St
- 113 3rd St
- 1345 County Road 16
- 37 State Route 60
- 3969 Town Line Road 187
- 816 Butler Rd S
- 141 State Route 60
- 141 Ohio 60
- 52814 New London Eastern Rd