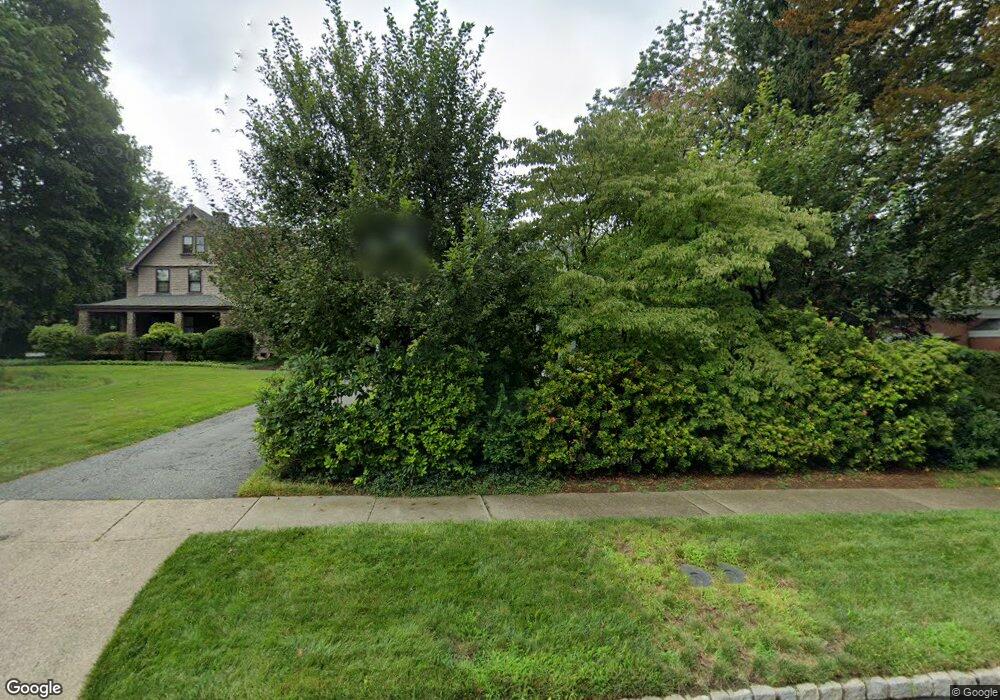
40 E Main St Mendham, NJ 07945
Estimated Value: $917,000 - $1,065,000
Studio
--
Bath
2,654
Sq Ft
$374/Sq Ft
Est. Value
About This Home
This home is located at 40 E Main St, Mendham, NJ 07945 and is currently estimated at $991,878, approximately $373 per square foot. 40 E Main St is a home located in Morris County with nearby schools including Hilltop Elementary School, Mountain View Middle School, and West Morris Mendham High School.
Ownership History
Date
Name
Owned For
Owner Type
Purchase Details
Closed on
Nov 14, 1996
Sold by
Garubo Louis and Garubo Rebecca A
Bought by
Mead David T and Mead Alexandra P
Current Estimated Value
Home Financials for this Owner
Home Financials are based on the most recent Mortgage that was taken out on this home.
Original Mortgage
$185,000
Outstanding Balance
$17,082
Interest Rate
7.37%
Estimated Equity
$974,796
Create a Home Valuation Report for This Property
The Home Valuation Report is an in-depth analysis detailing your home's value as well as a comparison with similar homes in the area
Home Values in the Area
Average Home Value in this Area
Purchase History
| Date | Buyer | Sale Price | Title Company |
|---|---|---|---|
| Mead David T | $280,000 | -- |
Source: Public Records
Mortgage History
| Date | Status | Borrower | Loan Amount |
|---|---|---|---|
| Open | Mead David T | $185,000 |
Source: Public Records
Tax History
| Year | Tax Paid | Tax Assessment Tax Assessment Total Assessment is a certain percentage of the fair market value that is determined by local assessors to be the total taxable value of land and additions on the property. | Land | Improvement |
|---|---|---|---|---|
| 2025 | $14,241 | $578,900 | $277,200 | $301,700 |
| 2024 | $14,206 | $578,900 | $277,200 | $301,700 |
Source: Public Records
Map
Nearby Homes
Your Personal Tour Guide
Ask me questions while you tour the home.