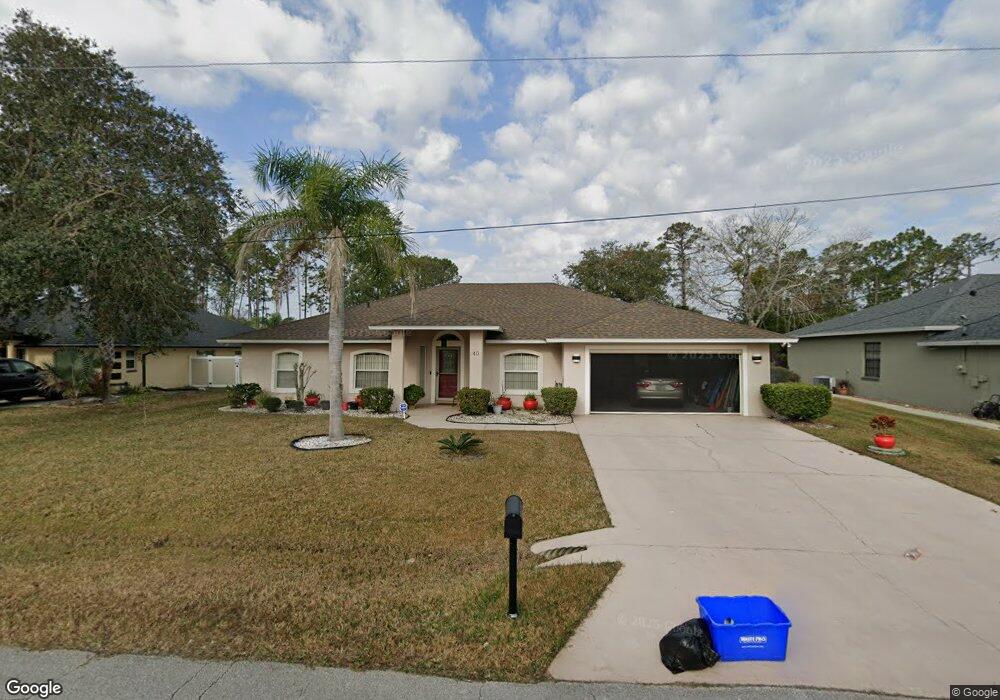
40 Elder Dr Palm Coast, FL 32164
Estimated Value: $355,012 - $440,000
3
Beds
2
Baths
1,962
Sq Ft
$208/Sq Ft
Est. Value
About This Home
This home is located at 40 Elder Dr, Palm Coast, FL 32164 and is currently estimated at $407,753, approximately $207 per square foot. 40 Elder Dr is a home located in Flagler County with nearby schools including Bunnell Elementary School, Buddy Taylor Middle School, and Flagler-Palm Coast High School.
Ownership History
Date
Name
Owned For
Owner Type
Purchase Details
Closed on
Aug 14, 2016
Sold by
Bather Latanya R
Bought by
Galicia Nadeen N and Bather Latanya R
Current Estimated Value
Purchase Details
Closed on
Sep 30, 2014
Sold by
Vogan James M and Vogan Christine F
Bought by
Bather Latanya R
Home Financials for this Owner
Home Financials are based on the most recent Mortgage that was taken out on this home.
Original Mortgage
$168,000
Interest Rate
4.15%
Mortgage Type
New Conventional
Purchase Details
Closed on
Jul 1, 2005
Sold by
Benson Robert J
Bought by
Vogan James M and Vogan Christine F
Home Financials for this Owner
Home Financials are based on the most recent Mortgage that was taken out on this home.
Original Mortgage
$171,000
Interest Rate
5.57%
Mortgage Type
Fannie Mae Freddie Mac
Purchase Details
Closed on
Sep 18, 2003
Sold by
Salom Richard and Solom Isobell
Bought by
Elder 40 Land Tr
Create a Home Valuation Report for This Property
The Home Valuation Report is an in-depth analysis detailing your home's value as well as a comparison with similar homes in the area
Home Values in the Area
Average Home Value in this Area
Purchase History
| Date | Buyer | Sale Price | Title Company |
|---|---|---|---|
| Galicia Nadeen N | -- | None Available | |
| Bather Latanya R | $210,000 | None Available | |
| Vogan James M | $286,000 | -- | |
| Elder 40 Land Tr | $45,000 | -- |
Source: Public Records
Mortgage History
| Date | Status | Borrower | Loan Amount |
|---|---|---|---|
| Previous Owner | Bather Latanya R | $168,000 | |
| Previous Owner | Vogan James M | $171,000 |
Source: Public Records
Tax History Compared to Growth
Tax History
| Year | Tax Paid | Tax Assessment Tax Assessment Total Assessment is a certain percentage of the fair market value that is determined by local assessors to be the total taxable value of land and additions on the property. | Land | Improvement |
|---|---|---|---|---|
| 2024 | $4,938 | $315,404 | $58,500 | $256,904 |
| 2023 | $4,938 | $257,410 | $0 | $0 |
| 2022 | $4,729 | $283,778 | $59,500 | $224,278 |
| 2021 | $4,142 | $212,735 | $35,000 | $177,735 |
| 2020 | $3,875 | $195,877 | $29,000 | $166,877 |
| 2019 | $3,948 | $197,377 | $30,500 | $166,877 |
| 2018 | $3,834 | $188,162 | $30,000 | $158,162 |
| 2017 | $3,575 | $175,348 | $25,000 | $150,348 |
| 2016 | $3,398 | $166,655 | $0 | $0 |
| 2015 | $3,242 | $157,855 | $0 | $0 |
| 2014 | $1,736 | $124,444 | $0 | $0 |
Source: Public Records
Map
Nearby Homes