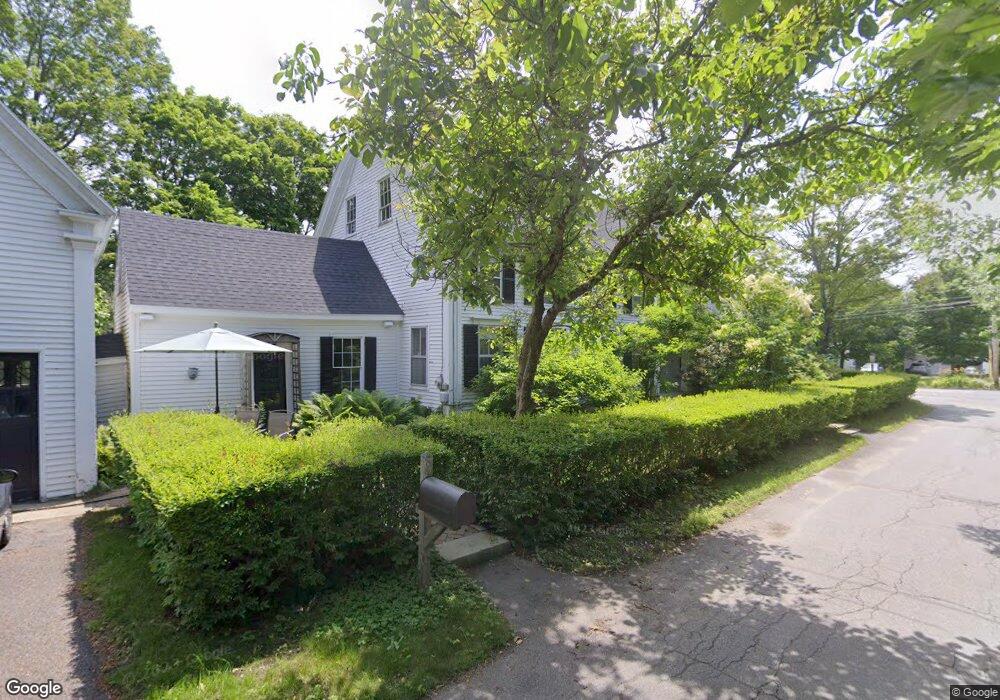
40 Elm St Topsham, ME 04086
Estimated Value: $440,000 - $697,000
3
Beds
2
Baths
2,900
Sq Ft
$201/Sq Ft
Est. Value
About This Home
This home is located at 40 Elm St, Topsham, ME 04086 and is currently estimated at $582,572, approximately $200 per square foot. 40 Elm St is a home located in Sagadahoc County with nearby schools including Mt Ararat High School, Harpswell Coastal Academy Divisions 2 and 3, and St. John's Catholic School.
Ownership History
Date
Name
Owned For
Owner Type
Purchase Details
Closed on
Oct 15, 2007
Sold by
King Maxine B Est
Bought by
Filtranti Mark C and Filtranti Kathleen A
Current Estimated Value
Home Financials for this Owner
Home Financials are based on the most recent Mortgage that was taken out on this home.
Original Mortgage
$305,000
Outstanding Balance
$192,312
Interest Rate
6.49%
Mortgage Type
VA
Estimated Equity
$390,260
Create a Home Valuation Report for This Property
The Home Valuation Report is an in-depth analysis detailing your home's value as well as a comparison with similar homes in the area
Home Values in the Area
Average Home Value in this Area
Purchase History
| Date | Buyer | Sale Price | Title Company |
|---|---|---|---|
| Filtranti Mark C | -- | -- |
Source: Public Records
Mortgage History
| Date | Status | Borrower | Loan Amount |
|---|---|---|---|
| Open | Filtranti Mark C | $305,000 |
Source: Public Records
Tax History Compared to Growth
Tax History
| Year | Tax Paid | Tax Assessment Tax Assessment Total Assessment is a certain percentage of the fair market value that is determined by local assessors to be the total taxable value of land and additions on the property. | Land | Improvement |
|---|---|---|---|---|
| 2025 | $7,153 | $558,800 | $57,300 | $501,500 |
| 2024 | $6,933 | $554,600 | $53,100 | $501,500 |
| 2023 | $6,650 | $489,700 | $50,600 | $439,100 |
| 2022 | $6,676 | $463,000 | $48,800 | $414,200 |
| 2021 | $6,756 | $425,700 | $44,800 | $380,900 |
| 2020 | $6,580 | $368,400 | $44,800 | $323,600 |
| 2019 | $6,530 | $341,000 | $44,800 | $296,200 |
| 2018 | $1,856 | $338,600 | $40,000 | $298,600 |
| 2017 | $6,135 | $338,600 | $40,000 | $298,600 |
| 2016 | $6,136 | $341,100 | $40,000 | $301,100 |
| 2015 | $6,216 | $346,100 | $40,000 | $306,100 |
| 2014 | $6,128 | $353,600 | $40,000 | $313,600 |
| 2013 | $5,887 | $353,600 | $40,000 | $313,600 |
Source: Public Records
Map
Nearby Homes
- 4 Wilson St
- 118 Main St
- 86 Merrymeeting Rd
- 15 Minat Ave
- 29 Winter St
- 26 Merrymeeting Rd
- 21 Barrows Dr
- 19 Mason St
- 11 Lincoln St
- 57 Winter St
- 10 Merrymeeting Dr
- 44 Forest Glen Ln
- 28 Forest Glen Ln
- 55 Somerset Place
- 43 Forest Glen Ln
- 19 Forest Glen Ln
- 23 Forest Glen Ln
- 35 Bath Rd
- 35.5 Bath Rd
- 35 & 35.5 Bath Rd