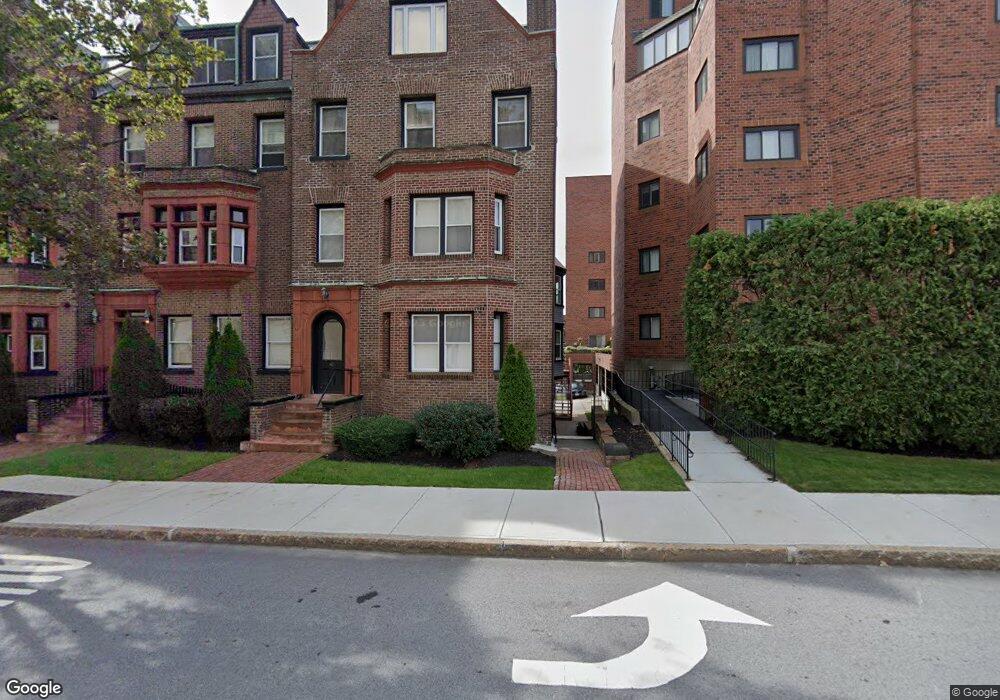
40 Elm St Unit 3 Worcester, MA 01609
Elm Park NeighborhoodEstimated Value: $246,000 - $301,704
2
Beds
1
Bath
1,100
Sq Ft
$249/Sq Ft
Est. Value
About This Home
This home is located at 40 Elm St Unit 3, Worcester, MA 01609 and is currently estimated at $273,926, approximately $249 per square foot. 40 Elm St Unit 3 is a home located in Worcester County with nearby schools including Jacob Hiatt Magnet School, Chandler Magnet, and Elm Park Elementary School.
Ownership History
Date
Name
Owned For
Owner Type
Purchase Details
Closed on
Nov 9, 2021
Sold by
Gara Andrew and Gara Alison
Bought by
Labonte Clarence and Cole Joanne L
Current Estimated Value
Home Financials for this Owner
Home Financials are based on the most recent Mortgage that was taken out on this home.
Original Mortgage
$226,350
Outstanding Balance
$203,971
Interest Rate
2.88%
Mortgage Type
Purchase Money Mortgage
Estimated Equity
$69,955
Purchase Details
Closed on
Sep 29, 2020
Sold by
Gara Andrew and Seale Sharon L
Bought by
Gara Andrew and Gara Alison
Home Financials for this Owner
Home Financials are based on the most recent Mortgage that was taken out on this home.
Original Mortgage
$146,250
Interest Rate
2.9%
Mortgage Type
New Conventional
Purchase Details
Closed on
Aug 23, 2005
Sold by
Quinn Kerry
Bought by
Seale Alison and Gara Andrew
Home Financials for this Owner
Home Financials are based on the most recent Mortgage that was taken out on this home.
Original Mortgage
$197,100
Interest Rate
5.66%
Mortgage Type
Purchase Money Mortgage
Create a Home Valuation Report for This Property
The Home Valuation Report is an in-depth analysis detailing your home's value as well as a comparison with similar homes in the area
Home Values in the Area
Average Home Value in this Area
Purchase History
We collect this data history from publicly available records. To have your information removed, we recommend requesting removal directly through your county’s website.
| Date | Buyer | Sale Price | Title Company |
|---|---|---|---|
| Labonte Clarence | $251,500 | None Available | |
| Gara Andrew | -- | None Available | |
| Seale Alison | $219,900 | -- | |
| Seale Alison R | $219,900 | -- |
Source: Public Records
Mortgage History
We collect this data history from publicly available records. To have your information removed, we recommend requesting removal directly through your county’s website.
| Date | Status | Borrower | Loan Amount |
|---|---|---|---|
| Open | Labonte Clarence | $226,350 | |
| Previous Owner | Gara Andrew | $146,250 | |
| Previous Owner | Seale Alison R | $197,100 |
Source: Public Records
Tax History
| Year | Tax Paid | Tax Assessment Tax Assessment Total Assessment is a certain percentage of the fair market value that is determined by local assessors to be the total taxable value of land and additions on the property. | Land | Improvement |
|---|---|---|---|---|
| 2025 | $3,309 | $250,900 | $0 | $250,900 |
| 2024 | $3,161 | $229,900 | $0 | $229,900 |
| 2023 | $3,163 | $220,600 | $0 | $220,600 |
| 2022 | $2,797 | $183,900 | $0 | $183,900 |
| 2021 | $2,965 | $182,100 | $0 | $182,100 |
| 2020 | $2,681 | $157,700 | $0 | $157,700 |
| 2019 | $2,752 | $152,900 | $0 | $152,900 |
| 2018 | $3,478 | $183,900 | $0 | $183,900 |
| 2017 | $3,000 | $156,100 | $0 | $156,100 |
| 2016 | $2,925 | $141,900 | $0 | $141,900 |
| 2015 | $2,848 | $141,900 | $0 | $141,900 |
| 2014 | $2,988 | $152,900 | $0 | $152,900 |
Source: Public Records
Map
Nearby Homes
- 131 Pleasant St
- 22 Elm St Unit 302
- 22 Elm St Unit 401
- 22 Elm St Unit 310
- 8 Ashland St Unit 8G
- 10 Ashland St Unit 2L
- 31 Chestnut St Unit 5
- 29 William St Unit 22
- 4 Chatham Place Unit 3
- 34 Irving St
- 12 Crown St
- 17 Federal St Unit 210
- 17 Federal St Unit 506
- 4 Home St
- 70 Southbridge St Unit 313
- 70 Southbridge St Unit 310
- 5 State St Unit 1
- 15 Goulding St
- 60 Fruit St
- 40 Merrick St Unit A
- 44 Elm St Unit 518
- 44 Elm St Unit 517
- 44 Elm St Unit 516
- 44 Elm St Unit 515
- 44 Elm St Unit 514
- 44 Elm St Unit 513
- 44 Elm St Unit 512
- 44 Elm St Unit 511
- 44 Elm St Unit 510
- 44 Elm St Unit 509
- 44 Elm St Unit 508
- 44 Elm St Unit 507
- 44 Elm St Unit 506
- 44 Elm St Unit 505
- 44 Elm St Unit 504
- 44 Elm St Unit 503
- 44 Elm St Unit 502
- 44 Elm St Unit 500
- 44 Elm St Unit 410
- 44 Elm St Unit 409
Your Personal Tour Guide
Ask me questions while you tour the home.