R
Landlord's Agent in 2026
Rhonda Drakeford
Drakeford Real Estate
(510) 228-2474
1 in this area
5 Total Sales
Estimated Value: $827,000 - $1,289,000
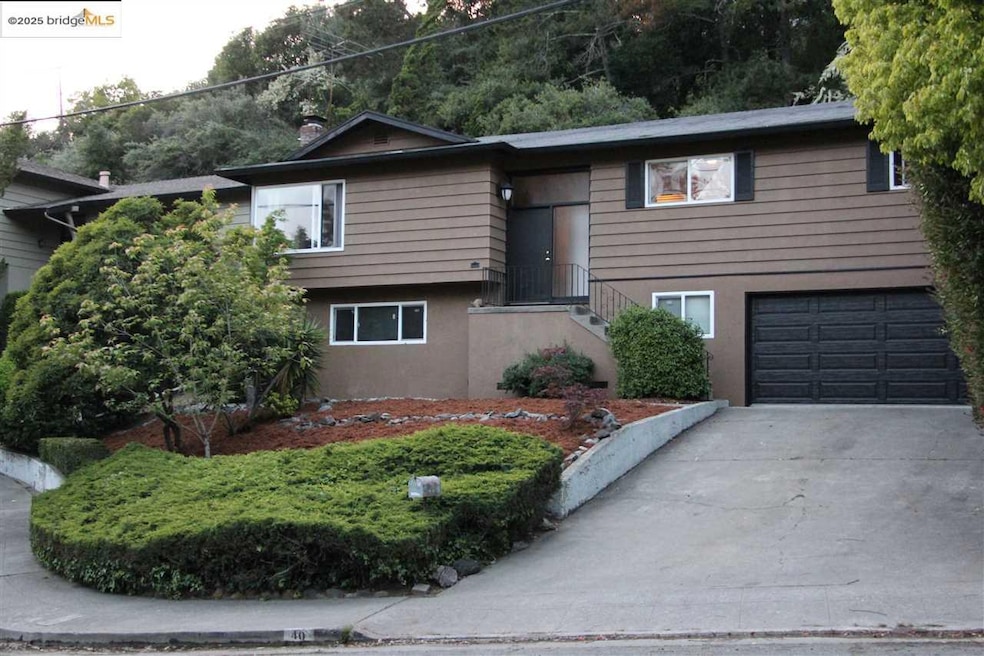
Serene Oakland Hills Retreat" House for Rent! This Property is UNFURNISHED, Furniture Photos are for staging only!! Delightful & Spacious House for rent, recently updated. Gracious Living Room w/Fireplace and Dining Room, Modern and updated Kitchen, Newer appliances, Cozy Nook near Kit, chill out in the family room, next to deck and patio/back yard. Laundry Room w/ Washer/Dryer. Original Red Oak hardwood floors throughout. One Generous Master Suite w/ full bath, two additional cozy private bedrooms upstairs. One large bedroom downstairs or could be used as a large family room or office. A workshop or office near the garage. Close to Sequoyah Country Golf Club & Chabot Country Golf Club, near Parks, Hiking trails, the Oakland Zoo, 24 hours patrol car for neighborhood safety, Close to Airport, Hospitals, Freeways etc. We welcome, Job Relocation, Traveling Nurses,Temp Housing, Business Opportunities, etc! I'm open to the most unique living Accommodations. Backyard Great For Gardening and Entertaining! Newly Landscaped! Tenants to pay all utilities except garbage. Property will be delivered vacant. Owners to pay for yard services, unless negotiated for backyard privacy. Please contact the owner for additional questions! Contact owner for move in Specials for Jan 2026
Last Agent to Rent the Property
Drakeford Real Estate License #01111900 Listed on: 09/14/2025
| Date | Buyer | Sale Price | Title Company |
|---|---|---|---|
| Drakeford Rhonda | -- | Commonwealth Land Title Co | |
| Drakeford Reginald L | -- | -- |
| Date | Event | Price | List to Sale | Price per Sq Ft |
|---|---|---|---|---|
| 01/30/2026 01/30/26 | Rented | $5,500,000 | +103673.6% | -- |
| 11/13/2025 11/13/25 | Price Changed | $5,300 | -3.6% | $2 / Sq Ft |
| 09/14/2025 09/14/25 | For Rent | $5,500 | -- | -- |
| Year | Tax Paid | Tax Assessment Tax Assessment Total Assessment is a certain percentage of the fair market value that is determined by local assessors to be the total taxable value of land and additions on the property. | Land | Improvement |
|---|---|---|---|---|
| 2025 | $7,500 | $450,730 | $135,219 | $315,511 |
| 2024 | $7,500 | $441,893 | $132,568 | $309,325 |
| 2023 | $7,819 | $433,230 | $129,969 | $303,261 |
| 2022 | $7,587 | $424,735 | $127,420 | $297,315 |
| 2021 | $8,483 | $416,407 | $124,922 | $291,485 |
| 2020 | $7,248 | $412,138 | $123,641 | $288,497 |
| 2019 | $9,221 | $404,057 | $121,217 | $282,840 |
| 2018 | $6,684 | $396,135 | $118,840 | $277,295 |
| 2017 | $6,418 | $388,368 | $116,510 | $271,858 |
| 2016 | $6,176 | $380,756 | $114,227 | $266,529 |
| 2015 | $6,765 | $375,038 | $112,511 | $262,527 |
| 2014 | $7,464 | $367,694 | $110,308 | $257,386 |
R
Landlord's Agent in 2026
Rhonda Drakeford
Drakeford Real Estate
(510) 228-2474
1 in this area
5 Total Sales
Source: bridgeMLS
MLS Number: 41111584
APN: 048-6506-021-00
Disclaimer: Certain information contained herein is derived from information provided by parties other than Homes.com. All information provided is deemed reliable, but is not guaranteed to be accurate and should be independently verified.
![]() Bay East 2026. CCAR 2026. bridgeMLS 2026. Information Deemed Reliable But Not Guaranteed. This information is being provided by the Bay East MLS, or CCAR MLS, or bridgeMLS. The listings presented here may or may not be listed by the Broker/Agent operating this website. This information is intended for the personal use of consumers and may not be used for any purpose other than to identify prospective properties consumers may be interested in purchasing.
Bay East 2026. CCAR 2026. bridgeMLS 2026. Information Deemed Reliable But Not Guaranteed. This information is being provided by the Bay East MLS, or CCAR MLS, or bridgeMLS. The listings presented here may or may not be listed by the Broker/Agent operating this website. This information is intended for the personal use of consumers and may not be used for any purpose other than to identify prospective properties consumers may be interested in purchasing.
Ask me questions while you tour the home.
