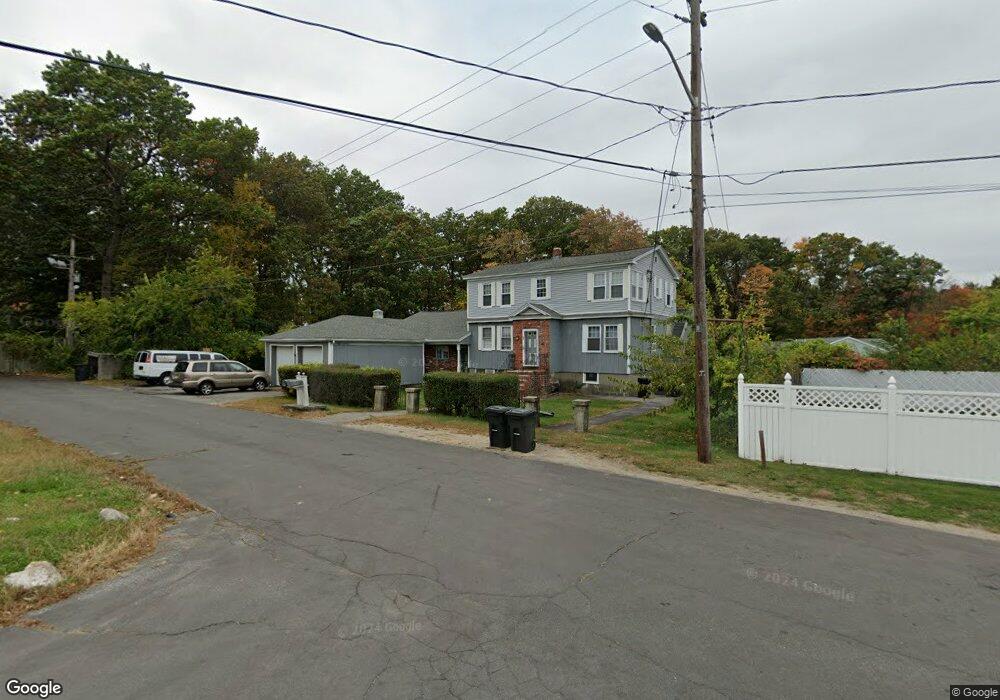
40 Fairview Ave Unit 2 Methuen, MA 01844
The East End NeighborhoodEstimated Value: $701,000 - $788,223
2
Beds
1
Bath
816
Sq Ft
$926/Sq Ft
Est. Value
About This Home
This home is located at 40 Fairview Ave Unit 2, Methuen, MA 01844 and is currently estimated at $755,556, approximately $925 per square foot. 40 Fairview Ave Unit 2 is a home located in Essex County with nearby schools including Timony Grammar School, Methuen High School, and Community Day Charter Public School - Gateway.
Ownership History
Date
Name
Owned For
Owner Type
Purchase Details
Closed on
Jun 29, 2016
Sold by
Malignaggi Lorraine G
Bought by
Joaquin Michael
Current Estimated Value
Home Financials for this Owner
Home Financials are based on the most recent Mortgage that was taken out on this home.
Original Mortgage
$372,135
Outstanding Balance
$292,595
Interest Rate
3.37%
Mortgage Type
FHA
Estimated Equity
$462,961
Purchase Details
Closed on
Apr 1, 1983
Bought by
Malignaggi Samuel and Malignaggi Lorraine G
Create a Home Valuation Report for This Property
The Home Valuation Report is an in-depth analysis detailing your home's value as well as a comparison with similar homes in the area
Home Values in the Area
Average Home Value in this Area
Purchase History
| Date | Buyer | Sale Price | Title Company |
|---|---|---|---|
| Joaquin Michael | $379,000 | -- | |
| Malignaggi Samuel | -- | -- |
Source: Public Records
Mortgage History
| Date | Status | Borrower | Loan Amount |
|---|---|---|---|
| Open | Joaquin Michael | $372,135 | |
| Closed | Joaquin Michael | $372,135 | |
| Previous Owner | Malignaggi Samuel | $134,270 |
Source: Public Records
Tax History
| Year | Tax Paid | Tax Assessment Tax Assessment Total Assessment is a certain percentage of the fair market value that is determined by local assessors to be the total taxable value of land and additions on the property. | Land | Improvement |
|---|---|---|---|---|
| 2025 | $7,841 | $741,100 | $253,000 | $488,100 |
| 2024 | $7,184 | $661,500 | $230,700 | $430,800 |
| 2023 | $6,733 | $575,500 | $205,100 | $370,400 |
| 2022 | $6,210 | $475,900 | $170,900 | $305,000 |
| 2021 | $5,949 | $451,000 | $162,400 | $288,600 |
| 2020 | $5,622 | $418,300 | $162,400 | $255,900 |
| 2019 | $5,404 | $380,800 | $145,300 | $235,500 |
| 2018 | $5,063 | $354,800 | $145,300 | $209,500 |
| 2017 | $4,804 | $327,900 | $145,300 | $182,600 |
| 2016 | $4,547 | $307,000 | $136,700 | $170,300 |
| 2015 | $4,371 | $299,400 | $136,700 | $162,700 |
Source: Public Records
Map
Nearby Homes
- 68 Ashford St
- 30 Anderson Dr
- 60 Ames St
- 396 Oak St
- 7 Erhardt Terrace
- 51 Ford St Unit A
- 18 Erhardt Terrace
- 65 Arthur St
- 5 Pilgrim Cir Unit C
- 1 Riverview Blvd Unit 8-203
- 12 Annette St
- 32 Josephine Ave
- 128 Pleasant Valley St
- 37 Albion St
- 106 Leroy Ave
- 39 Swan Ave
- 264 E Haverhill St Unit 2
- 14 Court St
- 10 Fenwick Cir
- 16 Christopher Dr Unit 38
Your Personal Tour Guide
Ask me questions while you tour the home.