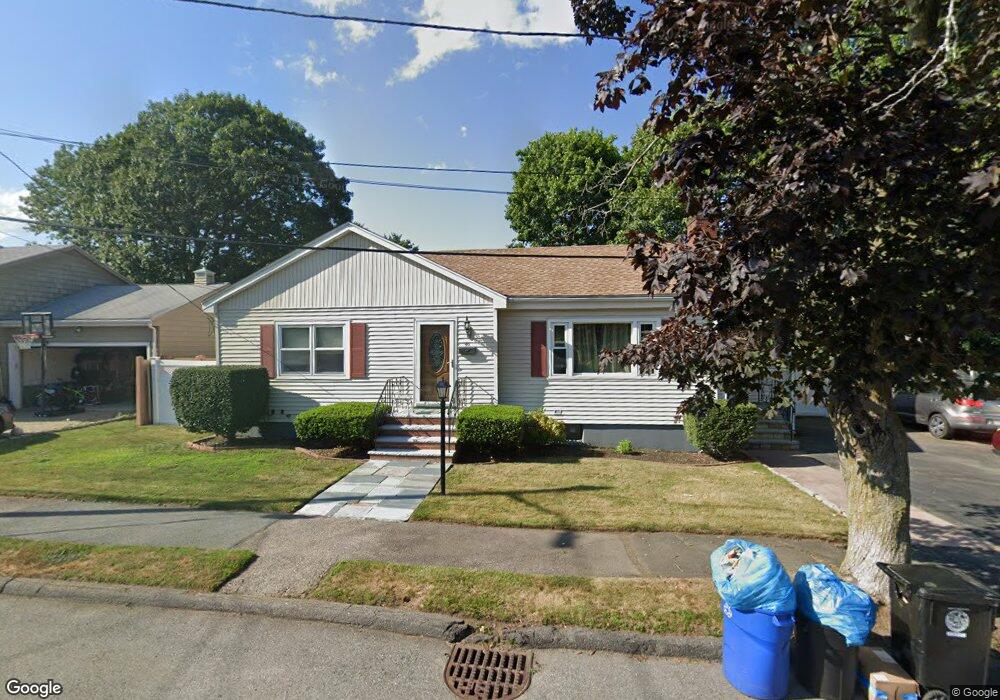
40 Fairview Ave Swampscott, MA 01907
Estimated Value: $639,000 - $823,000
2
Beds
2
Baths
2,305
Sq Ft
$304/Sq Ft
Est. Value
About This Home
This home is located at 40 Fairview Ave, Swampscott, MA 01907 and is currently estimated at $699,674, approximately $303 per square foot. 40 Fairview Ave is a home located in Essex County with nearby schools including Swampscott Middle School and Swampscott High School.
Ownership History
Date
Name
Owned For
Owner Type
Purchase Details
Closed on
Aug 3, 2017
Sold by
Nies Robert F and Shallow Sarah J
Bought by
Nies Robert F
Current Estimated Value
Purchase Details
Closed on
Sep 30, 2010
Sold by
Nies Robert F
Bought by
Nies Robert F and Shallow Sarah J
Home Financials for this Owner
Home Financials are based on the most recent Mortgage that was taken out on this home.
Original Mortgage
$200,000
Interest Rate
4.48%
Mortgage Type
Purchase Money Mortgage
Purchase Details
Closed on
Sep 27, 2010
Sold by
Faia Michael and Faia Lori
Bought by
Nies Robert F
Home Financials for this Owner
Home Financials are based on the most recent Mortgage that was taken out on this home.
Original Mortgage
$200,000
Interest Rate
4.48%
Mortgage Type
Purchase Money Mortgage
Purchase Details
Closed on
Dec 9, 1997
Sold by
Sellers Karen A
Bought by
Faia Michael and Faia Lori
Purchase Details
Closed on
Aug 6, 1993
Sold by
Faia Eugene A and Faia Mary
Bought by
Sellers Karen A
Create a Home Valuation Report for This Property
The Home Valuation Report is an in-depth analysis detailing your home's value as well as a comparison with similar homes in the area
Home Values in the Area
Average Home Value in this Area
Purchase History
| Date | Buyer | Sale Price | Title Company |
|---|---|---|---|
| Nies Robert F | -- | -- | |
| Nies Robert F | -- | -- | |
| Nies Robert F | -- | -- | |
| Nies Robert F | -- | -- | |
| Nies Robert F | $310,000 | -- | |
| Nies Robert F | $310,000 | -- | |
| Faia Michael | $150,000 | -- | |
| Faia Michael | $150,000 | -- | |
| Sellers Karen A | $140,000 | -- | |
| Sellers Karen A | $140,000 | -- |
Source: Public Records
Mortgage History
| Date | Status | Borrower | Loan Amount |
|---|---|---|---|
| Previous Owner | Sellers Karen A | $200,000 |
Source: Public Records
Tax History
| Year | Tax Paid | Tax Assessment Tax Assessment Total Assessment is a certain percentage of the fair market value that is determined by local assessors to be the total taxable value of land and additions on the property. | Land | Improvement |
|---|---|---|---|---|
| 2025 | $6,721 | $586,000 | $248,000 | $338,000 |
| 2024 | $7,356 | $640,200 | $236,200 | $404,000 |
| 2023 | $6,256 | $532,900 | $218,700 | $314,200 |
| 2022 | $5,777 | $450,300 | $192,500 | $257,800 |
| 2021 | $5,543 | $401,700 | $166,200 | $235,500 |
| 2020 | $5,556 | $388,500 | $157,500 | $231,000 |
| 2019 | $5,615 | $369,400 | $140,000 | $229,400 |
| 2018 | $5,910 | $369,400 | $140,000 | $229,400 |
| 2017 | $5,717 | $327,600 | $113,700 | $213,900 |
| 2016 | $5,527 | $318,900 | $105,000 | $213,900 |
| 2015 | $5,469 | $318,900 | $105,000 | $213,900 |
| 2014 | $4,914 | $262,800 | $87,500 | $175,300 |
Source: Public Records
Map
Nearby Homes
- 445 Essex St Unit 304
- 441 Essex St Unit 302
- 3 Didio Dr
- 1004 Paradise Rd Unit 1L
- 50 Mountwood Rd
- 51 Mountwood Rd
- 1002 Paradise Rd Unit PHE
- 49 Weatherly Dr
- 30 Weatherly Dr
- 11 Weatherly Dr
- 64 Stetson Ave
- 71 Walnut Rd
- 178 Norfolk Ave
- 46 Stetson Ave
- 106 Norfolk Ave
- 1 Bond St
- 80 Norfolk Ave Unit 1
- 75 Bay View Dr
- 10 Arbutus Rd
- 40 Buena Vista St
- 38 Fairview Ave
- 42 Fairview Ave
- 25 Dead Eye Run
- 21 Dead Eye Run
- 17 Dead Eye Run
- 11 Dead Eye Run
- 9 Dead Eye Run
- 1 Dead Eye Run
- 9 Dead Eye Run Unit 9
- 11 Dead Eye Run Unit 11
- 9 Dead Eye Run Unit 200
- 23 Dead Eye Run
- 7 Dead Eye Run
- 5 Dead Eye Run
- 3 Dead Eye Run
- 3 Dead Eye Run Unit R-85
- 23 Dead Eye Run Unit 1
- 5 Dead Eye Run Unit 86
- 37 Fairview Ave
- 41 Fairview Ave
Your Personal Tour Guide
Ask me questions while you tour the home.