K
Landlord's Agent in 2021
Kelly Robbins
Charlesgate Realty Group, llc
3 in this area
6 Total Sales
Estimated Value: $660,706 - $847,000
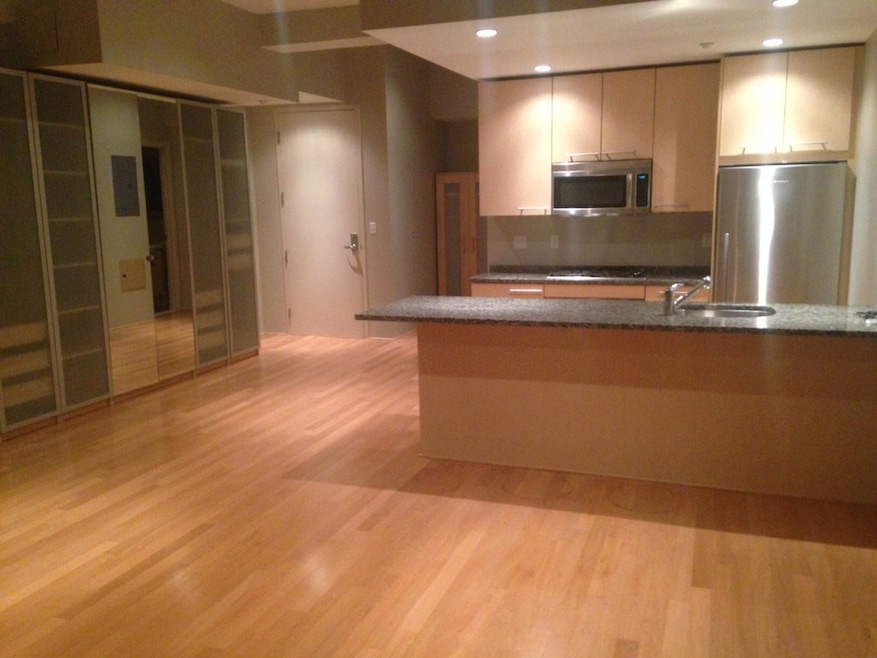
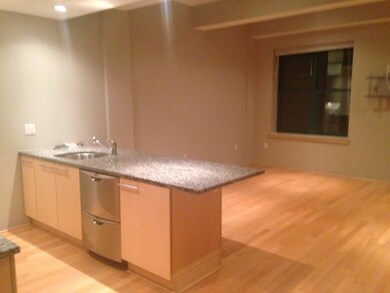
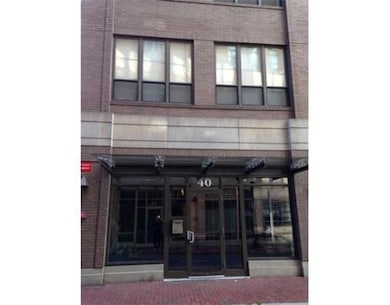
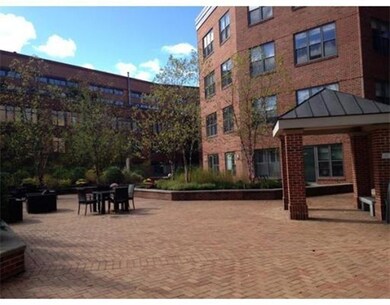
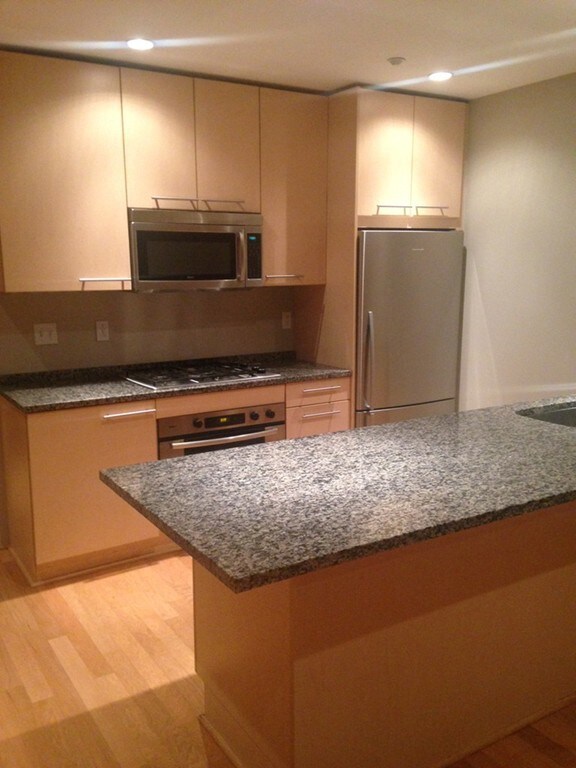
Gorgeous loft in bustling SOWA available Sept 1t! This amazing unit features high end appliances with granite counters and maple cabinets, high ceilings, in unit washer/dryer and central air/heat in an elevator building. Gas cooking and high end stainless appliances with dishwasher. Condo association features common courtyard with common gas grill and comfortable outdoor living area. Whole foods Market and InkBlock fitness and restaurant options just 2 blocks away. Enjoy SOWA Sundays with popular open produce market, local artisans, vintage market and food trucks. Easy commute to downtown and Copley with easy walk to Red and Orange lines, 9&11 bus to Copley and Downtown, and Silver line. Walking distance to Tufts and Boston Medical. No shortage of fantastic dining options nearby. Yes to pets!
| Date | Buyer | Sale Price | Title Company |
|---|---|---|---|
| 16 Hancock Holdings Llc | -- | None Available | |
| Naigamwalla Darius | $452,500 | -- | |
| Fnma | $445,908 | -- |
| Date | Status | Borrower | Loan Amount |
|---|---|---|---|
| Previous Owner | Naigamwalla Darius | $339,375 |
| Date | Event | Price | List to Sale | Price per Sq Ft | Prior Sale |
|---|---|---|---|---|---|
| 08/26/2021 08/26/21 | Rented | -- | -- | -- | |
| 08/23/2021 08/23/21 | Under Contract | -- | -- | -- | |
| 08/09/2021 08/09/21 | For Rent | $2,400 | 0.0% | -- | |
| 05/15/2018 05/15/18 | Rented | $2,400 | 0.0% | -- | |
| 05/08/2018 05/08/18 | Under Contract | -- | -- | -- | |
| 04/13/2018 04/13/18 | For Rent | $2,400 | +9.1% | -- | |
| 08/15/2015 08/15/15 | Rented | $2,200 | -8.3% | -- | |
| 07/16/2015 07/16/15 | Under Contract | -- | -- | -- | |
| 06/25/2015 06/25/15 | For Rent | $2,400 | 0.0% | -- | |
| 06/19/2015 06/19/15 | Sold | $452,500 | -3.7% | $698 / Sq Ft | View Prior Sale |
| 04/28/2015 04/28/15 | Pending | -- | -- | -- | |
| 03/31/2015 03/31/15 | For Sale | $469,900 | -- | $725 / Sq Ft |
| Year | Tax Paid | Tax Assessment Tax Assessment Total Assessment is a certain percentage of the fair market value that is determined by local assessors to be the total taxable value of land and additions on the property. | Land | Improvement |
|---|---|---|---|---|
| 2025 | $7,310 | $631,300 | $0 | $631,300 |
| 2024 | $6,715 | $616,100 | $0 | $616,100 |
| 2023 | $6,485 | $603,800 | $0 | $603,800 |
| 2022 | $6,505 | $597,900 | $0 | $597,900 |
| 2021 | $6,255 | $586,200 | $0 | $586,200 |
| 2020 | $5,358 | $507,400 | $0 | $507,400 |
| 2019 | $5,191 | $492,500 | $0 | $492,500 |
| 2018 | $4,867 | $464,400 | $0 | $464,400 |
| 2017 | $4,684 | $442,300 | $0 | $442,300 |
| 2016 | $5,210 | $473,600 | $0 | $473,600 |
| 2015 | $4,820 | $398,000 | $0 | $398,000 |
| 2014 | -- | $361,200 | $0 | $361,200 |
K
Landlord's Agent in 2021
Kelly Robbins
Charlesgate Realty Group, llc
3 in this area
6 Total Sales

Tenant's Agent in 2021
Frank Carroll Homes Team
Compass
(617) 721-7461
12 in this area
84 Total Sales
M
Buyer's Agent in 2018
Megan St. Amand
Key Realty Group, LLC
K
Seller's Agent in 2015
Kieran Brosnan
Brosnan Realty Group, Inc.
(617) 212-1315
7 Total Sales
D
Buyer's Agent in 2015
Daniel Wallach
CW Realty
Source: MLS Property Information Network (MLS PIN)
MLS Number: 72878343
APN: CBOS-000000-000003-006390-000072
Disclaimer: Certain information contained herein is derived from information provided by parties other than Homes.com. All information provided is deemed reliable, but is not guaranteed to be accurate and should be independently verified.
![]() The property listing data and information, or the Images, set forth herein were provided to MLS Property Information Network, Inc. from third party sources, including sellers, lessors and public records, and were compiled by MLS Property Information Network, Inc. The property listing data and information, and the Images, are for the personal, non-commercial use of consumers having a good faith interest in purchasing or leasing listed properties of the type displayed to them and may not be used for any purpose other than to identify prospective properties which such consumers may have a good faith interest in purchasing or leasing. MLS Property Information Network, Inc. and its subscribers disclaim any and all representations and warranties as to the accuracy of the property listing data and information, or as to the accuracy of any of the Images, set forth herein.
The property listing data and information, or the Images, set forth herein were provided to MLS Property Information Network, Inc. from third party sources, including sellers, lessors and public records, and were compiled by MLS Property Information Network, Inc. The property listing data and information, and the Images, are for the personal, non-commercial use of consumers having a good faith interest in purchasing or leasing listed properties of the type displayed to them and may not be used for any purpose other than to identify prospective properties which such consumers may have a good faith interest in purchasing or leasing. MLS Property Information Network, Inc. and its subscribers disclaim any and all representations and warranties as to the accuracy of the property listing data and information, or as to the accuracy of any of the Images, set forth herein.