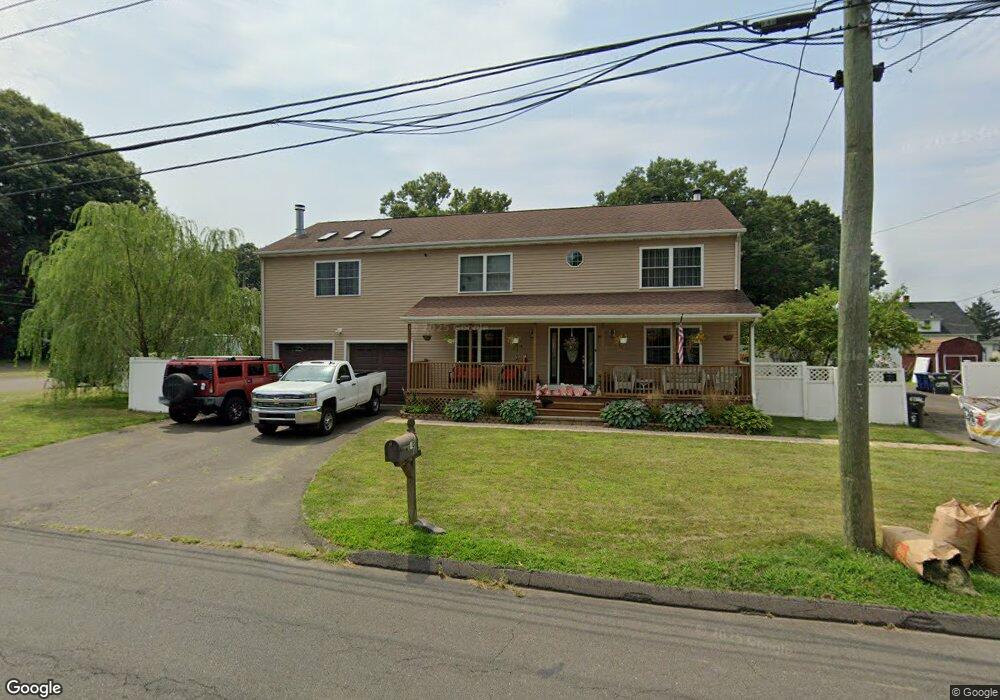
40 Fenwick St West Haven, CT 06516
Allingtown NeighborhoodEstimated Value: $321,000 - $532,000
4
Beds
3
Baths
1,478
Sq Ft
$274/Sq Ft
Est. Value
About This Home
This home is located at 40 Fenwick St, West Haven, CT 06516 and is currently estimated at $404,282, approximately $273 per square foot. 40 Fenwick St is a home located in New Haven County with nearby schools including Carrigan 5/6 Intermediate School, Harry M. Bailey Middle School, and West Haven High School.
Ownership History
Date
Name
Owned For
Owner Type
Purchase Details
Closed on
Jun 26, 2025
Sold by
Amcar Properties Llc
Bought by
Amcar Properties Llc
Current Estimated Value
Home Financials for this Owner
Home Financials are based on the most recent Mortgage that was taken out on this home.
Original Mortgage
$227,500
Outstanding Balance
$226,536
Interest Rate
6.89%
Mortgage Type
Future Advance Clause Open End Mortgage
Estimated Equity
$177,746
Purchase Details
Closed on
Sep 24, 2024
Sold by
Carrie-Ann Malangone Irt and Freel
Bought by
Amcar Prop Llc
Purchase Details
Closed on
Jul 26, 2023
Sold by
Malangone Carrie-Ann
Bought by
Carrie-Ann Malangone Irt and Freel
Purchase Details
Closed on
Feb 6, 2023
Sold by
Malangone Anthony Est
Bought by
Malangone Carrie-Ann
Purchase Details
Closed on
May 23, 2002
Sold by
Perry John A and Perry Helen
Bought by
Russo Carrie A and Malangone Anthony
Home Financials for this Owner
Home Financials are based on the most recent Mortgage that was taken out on this home.
Original Mortgage
$161,400
Interest Rate
7.01%
Mortgage Type
Purchase Money Mortgage
Purchase Details
Closed on
Oct 2, 1998
Sold by
Czarowski Jean
Bought by
Perry John A and Perry Helen
Create a Home Valuation Report for This Property
The Home Valuation Report is an in-depth analysis detailing your home's value as well as a comparison with similar homes in the area
Home Values in the Area
Average Home Value in this Area
Purchase History
| Date | Buyer | Sale Price | Title Company |
|---|---|---|---|
| Amcar Properties Llc | -- | -- | |
| Amcar Prop Llc | -- | None Available | |
| Amcar Prop Llc | -- | None Available | |
| Carrie-Ann Malangone Irt | -- | None Available | |
| Carrie-Ann Malangone Irt | -- | None Available | |
| Malangone Carrie-Ann | -- | None Available | |
| Russo Carrie A | $169,900 | -- | |
| Russo Carrie A | $169,900 | -- | |
| Perry John A | $48,000 | -- | |
| Perry John A | $48,000 | -- |
Source: Public Records
Mortgage History
| Date | Status | Borrower | Loan Amount |
|---|---|---|---|
| Open | Amcar Properties Llc | $227,500 | |
| Previous Owner | Perry John A | $265,400 | |
| Previous Owner | Perry John A | $225,000 | |
| Previous Owner | Perry John A | $161,400 |
Source: Public Records
Tax History
| Year | Tax Paid | Tax Assessment Tax Assessment Total Assessment is a certain percentage of the fair market value that is determined by local assessors to be the total taxable value of land and additions on the property. | Land | Improvement |
|---|---|---|---|---|
| 2025 | $7,483 | $220,010 | $65,730 | $154,280 |
| 2024 | $6,765 | $141,260 | $45,570 | $95,690 |
| 2023 | $6,557 | $141,260 | $45,570 | $95,690 |
| 2022 | $10,788 | $236,530 | $45,780 | $190,750 |
| 2021 | $6,444 | $236,530 | $45,780 | $190,750 |
| 2020 | $6,084 | $219,380 | $37,310 | $182,070 |
| 2019 | $6,084 | $219,380 | $37,310 | $182,070 |
| 2018 | $5,565 | $219,380 | $37,310 | $182,070 |
| 2017 | $5,849 | $219,380 | $37,310 | $182,070 |
| 2016 | $10,164 | $219,380 | $37,310 | $182,070 |
| 2015 | $10,026 | $246,400 | $39,900 | $206,500 |
| 2014 | $9,826 | $246,400 | $39,900 | $206,500 |
Source: Public Records
Map
Nearby Homes
- 23 Yates St
- 110 Fenwick St
- 0 Burwell & Woodfield Rd Unit 24051262
- 0 Burwell Rd
- 71 Sycaway St
- 148 Burwell Rd
- 50 Morris Ave
- 38 Chauncey St
- 82 Hemlock St
- 11 Priscilla Rd
- 65 Westfield St
- 22 Bristol St
- 690 Forest Rd Unit 702
- 690 Forest Rd Unit 761
- 690 Forest Rd Unit 501
- 81 Homeside Ave
- 699 Forest Rd
- 31 Hinman St
- 14 Homestead Ave
- 194 Homeside Ave