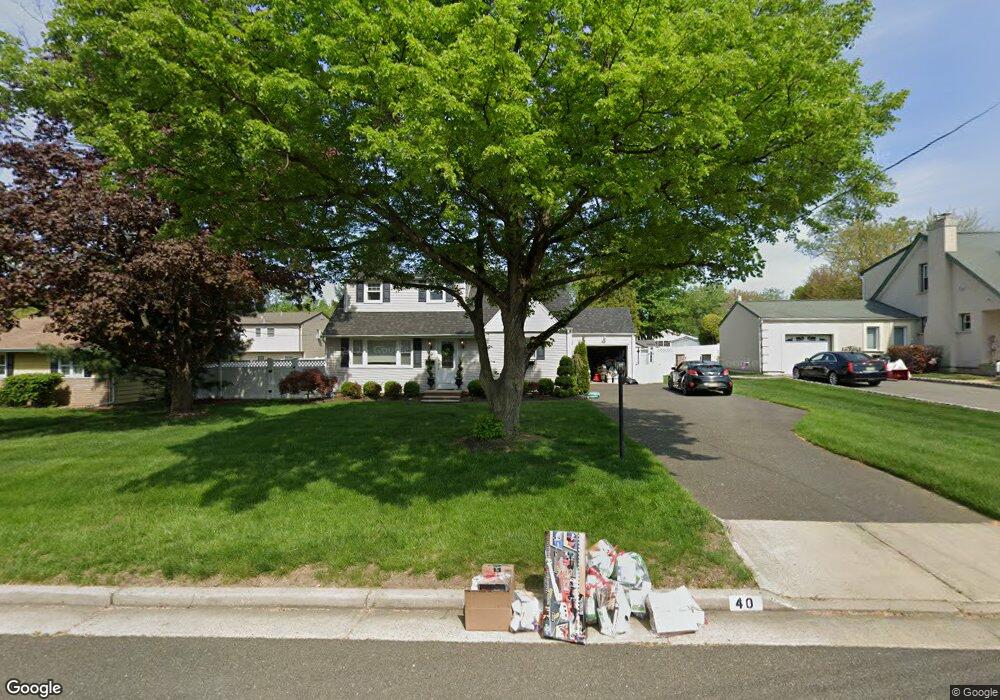
40 Fierro Ave Matawan, NJ 07747
Estimated Value: $573,000 - $608,000
2
Beds
2
Baths
1,382
Sq Ft
$423/Sq Ft
Est. Value
About This Home
This home is located at 40 Fierro Ave, Matawan, NJ 07747 and is currently estimated at $584,129, approximately $422 per square foot. 40 Fierro Ave is a home located in Monmouth County with nearby schools including Matawan Reg High School, Matawan Montessori Academy, and St. Joseph Elementary School.
Ownership History
Date
Name
Owned For
Owner Type
Purchase Details
Closed on
Nov 27, 2007
Sold by
Kilbride Christopher G and Orgo Jennifer L
Bought by
Romano John and Romano Jacqueline
Current Estimated Value
Home Financials for this Owner
Home Financials are based on the most recent Mortgage that was taken out on this home.
Original Mortgage
$346,750
Outstanding Balance
$219,138
Interest Rate
6.27%
Mortgage Type
Purchase Money Mortgage
Estimated Equity
$364,991
Purchase Details
Closed on
Nov 4, 2004
Sold by
Damaskinos Jennifer
Bought by
Kilbride Christopher and Kilbride Jennifer
Home Financials for this Owner
Home Financials are based on the most recent Mortgage that was taken out on this home.
Original Mortgage
$333,700
Interest Rate
5.75%
Purchase Details
Closed on
Jun 17, 1998
Sold by
Horowitz Linda
Bought by
Damaskinos Thomas and Damaskinos Jennifer
Home Financials for this Owner
Home Financials are based on the most recent Mortgage that was taken out on this home.
Original Mortgage
$139,000
Interest Rate
6.98%
Mortgage Type
FHA
Create a Home Valuation Report for This Property
The Home Valuation Report is an in-depth analysis detailing your home's value as well as a comparison with similar homes in the area
Home Values in the Area
Average Home Value in this Area
Purchase History
| Date | Buyer | Sale Price | Title Company |
|---|---|---|---|
| Romano John | $365,000 | Forward Action Title Agency | |
| Kilbride Christopher | $355,000 | -- | |
| Damaskinos Thomas | $140,000 | -- |
Source: Public Records
Mortgage History
| Date | Status | Borrower | Loan Amount |
|---|---|---|---|
| Open | Romano John | $346,750 | |
| Previous Owner | Kilbride Christopher | $333,700 | |
| Previous Owner | Damaskinos Thomas | $139,000 |
Source: Public Records
Tax History Compared to Growth
Tax History
| Year | Tax Paid | Tax Assessment Tax Assessment Total Assessment is a certain percentage of the fair market value that is determined by local assessors to be the total taxable value of land and additions on the property. | Land | Improvement |
|---|---|---|---|---|
| 2025 | $9,852 | $536,200 | $355,500 | $180,700 |
| 2024 | $9,561 | $451,300 | $307,500 | $143,800 |
| 2023 | $9,561 | $439,800 | $297,500 | $142,300 |
| 2022 | $9,197 | $400,500 | $265,000 | $135,500 |
| 2021 | $6,835 | $338,500 | $215,000 | $123,500 |
| 2020 | $8,947 | $327,000 | $205,000 | $122,000 |
| 2019 | $8,367 | $306,500 | $187,500 | $119,000 |
| 2018 | $8,048 | $290,000 | $172,500 | $117,500 |
| 2017 | $7,958 | $282,700 | $167,500 | $115,200 |
| 2016 | $7,750 | $281,200 | $167,500 | $113,700 |
| 2015 | $8,093 | $295,900 | $162,500 | $133,400 |
| 2014 | $7,916 | $290,500 | $152,500 | $138,000 |
Source: Public Records
Map
Nearby Homes
- 23 Annmar Dr
- 74 Lexington Cir
- 22 Overhill Rd
- 27 Middlesex Rd
- 26 Edgewater Dr
- 4377 Old Bridge Matawan Rd
- 39 Laurie Ct
- 7 Sunset Ave
- 65 Laurie Ct
- 65 Laurie Ct Unit 180
- 37 New Brunswick Ave
- 81 Letts Ct
- 81 Letts Ct Unit 160
- 258 Jackson St
- 14 New Brunswick Ave
- 181 Heywood Ct
- 320 Main St
- 16 Clearbrook Ct
- 284 Broad St
- 9 Fountain Ave