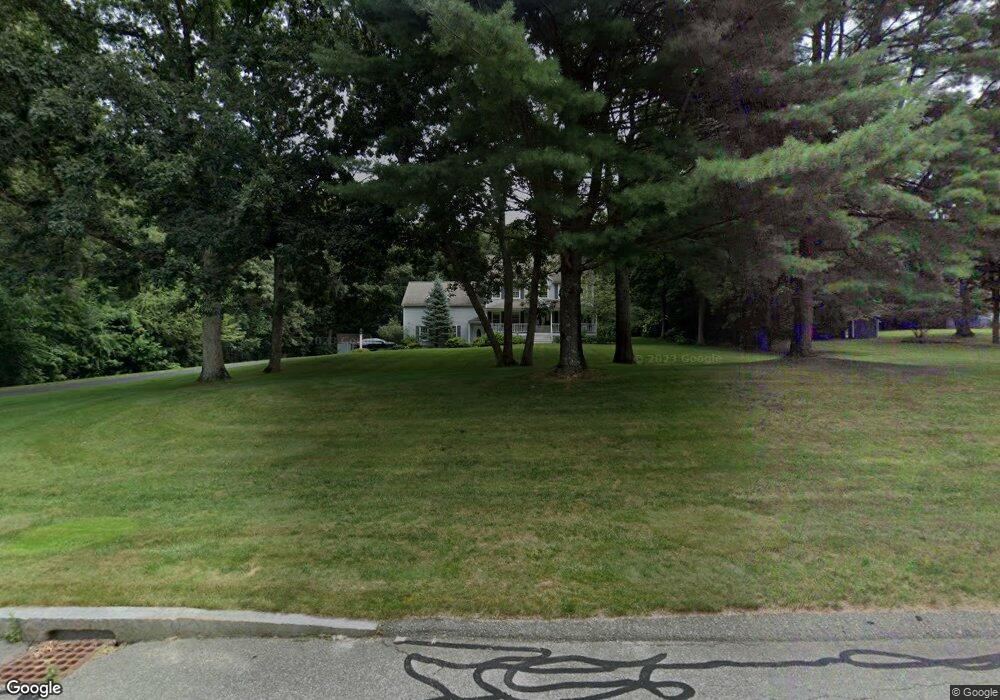
40 Follett Dr Wrentham, MA 02093
West Wrentham NeighborhoodEstimated Value: $1,027,555 - $1,324,000
4
Beds
4
Baths
2,862
Sq Ft
$401/Sq Ft
Est. Value
About This Home
This home is located at 40 Follett Dr, Wrentham, MA 02093 and is currently estimated at $1,147,889, approximately $401 per square foot. 40 Follett Dr is a home located in Norfolk County with nearby schools including Delaney Elementary School, Charles E Roderick, and Mercymount Country Day School.
Ownership History
Date
Name
Owned For
Owner Type
Purchase Details
Closed on
Jun 12, 2000
Sold by
Letourneau Steven C and Letourneau Donna J
Bought by
Rohan Michael E and Rohan Maureen D
Current Estimated Value
Home Financials for this Owner
Home Financials are based on the most recent Mortgage that was taken out on this home.
Original Mortgage
$285,000
Interest Rate
8.12%
Mortgage Type
Purchase Money Mortgage
Create a Home Valuation Report for This Property
The Home Valuation Report is an in-depth analysis detailing your home's value as well as a comparison with similar homes in the area
Home Values in the Area
Average Home Value in this Area
Purchase History
| Date | Buyer | Sale Price | Title Company |
|---|---|---|---|
| Rohan Michael E | $425,000 | -- |
Source: Public Records
Mortgage History
| Date | Status | Borrower | Loan Amount |
|---|---|---|---|
| Open | Rohan Michael E | $274,000 | |
| Closed | Rohan Michael E | $285,000 | |
| Previous Owner | Rohan Michael E | $45,000 | |
| Previous Owner | Rohan Michael E | $30,500 |
Source: Public Records
Tax History
| Year | Tax Paid | Tax Assessment Tax Assessment Total Assessment is a certain percentage of the fair market value that is determined by local assessors to be the total taxable value of land and additions on the property. | Land | Improvement |
|---|---|---|---|---|
| 2025 | $10,225 | $882,200 | $332,800 | $549,400 |
| 2024 | $9,815 | $817,900 | $332,800 | $485,100 |
| 2023 | $9,845 | $780,100 | $302,800 | $477,300 |
| 2022 | $9,375 | $685,800 | $282,900 | $402,900 |
| 2021 | $8,666 | $615,900 | $247,100 | $368,800 |
| 2020 | $8,818 | $618,800 | $220,100 | $398,700 |
| 2019 | $8,482 | $600,700 | $220,100 | $380,600 |
| 2018 | $7,989 | $561,000 | $219,700 | $341,300 |
| 2017 | $7,830 | $549,500 | $215,500 | $334,000 |
| 2016 | $7,666 | $536,800 | $209,200 | $327,600 |
| 2015 | $7,643 | $510,200 | $201,200 | $309,000 |
| 2014 | $7,572 | $494,600 | $193,500 | $301,100 |
Source: Public Records
Map
Nearby Homes
- 10 Follett Dr
- 1620 West St
- 60 Grant Ave
- 1565 West St
- 2095 West St
- 9 Reagan Ave
- 172 Pine Swamp Rd
- 25 Nature View Dr
- 180 Pine Swamp Rd
- 56 Pine Swamp Rd
- 900 Washington St Lot 2
- 365 W Wrentham Rd
- 20 Nature View Dr
- 925 Washington St
- 47 Austin Dr
- 9 Pebble Cir Unit 9
- 1 Spring St
- 65 Palmetto Dr Unit 65
- 9 Brookfield Ln
- 21 Palmetto Dr Unit 21
Your Personal Tour Guide
Ask me questions while you tour the home.