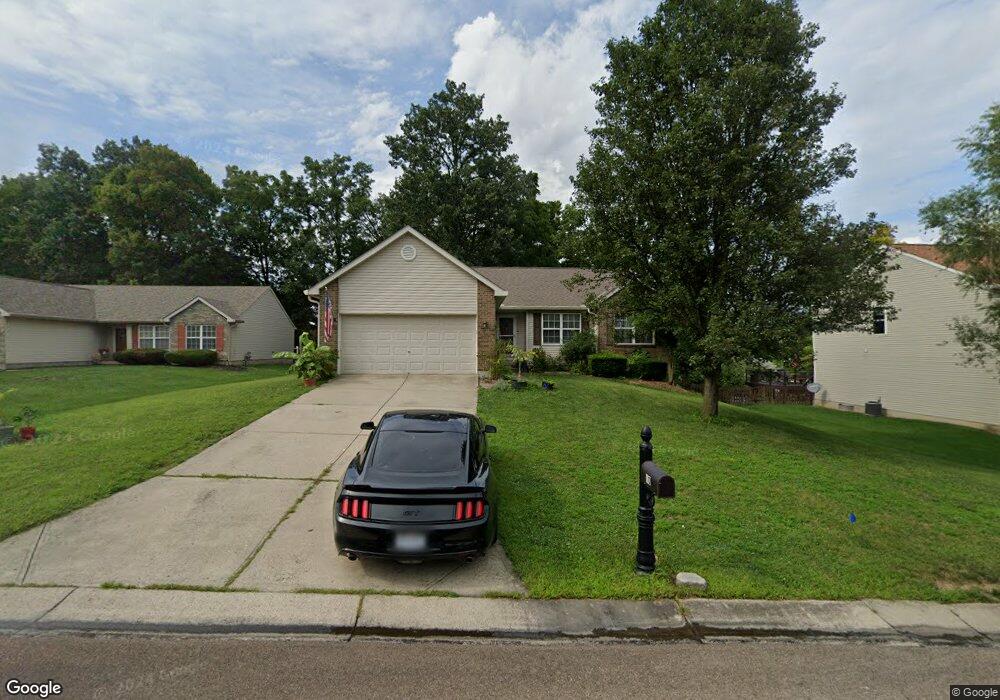
40 Forest View Ct Monroe, OH 45050
Estimated Value: $306,000 - $347,706
3
Beds
2
Baths
1,506
Sq Ft
$216/Sq Ft
Est. Value
About This Home
This home is located at 40 Forest View Ct, Monroe, OH 45050 and is currently estimated at $324,677, approximately $215 per square foot. 40 Forest View Ct is a home located in Butler County with nearby schools including Monroe Primary School, Monroe Elementary School, and Monroe Junior High School.
Ownership History
Date
Name
Owned For
Owner Type
Purchase Details
Closed on
Jun 1, 2007
Sold by
Coning Timothy S and Coning Rebecca L
Bought by
Vest Judy
Current Estimated Value
Home Financials for this Owner
Home Financials are based on the most recent Mortgage that was taken out on this home.
Original Mortgage
$147,725
Outstanding Balance
$88,776
Interest Rate
6.22%
Mortgage Type
Purchase Money Mortgage
Estimated Equity
$235,901
Purchase Details
Closed on
Sep 26, 2003
Sold by
The Cristo Group Inc
Bought by
Coning Timothy S and Coning Rebecca L
Home Financials for this Owner
Home Financials are based on the most recent Mortgage that was taken out on this home.
Original Mortgage
$140,472
Interest Rate
8.95%
Mortgage Type
Purchase Money Mortgage
Create a Home Valuation Report for This Property
The Home Valuation Report is an in-depth analysis detailing your home's value as well as a comparison with similar homes in the area
Home Values in the Area
Average Home Value in this Area
Purchase History
We collect this data history from publicly available records. To have your information removed, we recommend requesting removal directly through your county’s website.
| Date | Buyer | Sale Price | Title Company |
|---|---|---|---|
| Vest Judy | $155,500 | Attorney | |
| Coning Timothy S | $156,510 | -- |
Source: Public Records
Mortgage History
We collect this data history from publicly available records. To have your information removed, we recommend requesting removal directly through your county’s website.
| Date | Status | Borrower | Loan Amount |
|---|---|---|---|
| Open | Vest Judy | $147,725 | |
| Previous Owner | Coning Timothy S | $140,472 | |
| Closed | Coning Timothy S | $7,804 |
Source: Public Records
Tax History
| Year | Tax Paid | Tax Assessment Tax Assessment Total Assessment is a certain percentage of the fair market value that is determined by local assessors to be the total taxable value of land and additions on the property. | Land | Improvement |
|---|---|---|---|---|
| 2025 | $4,470 | $99,060 | $14,550 | $84,510 |
| 2024 | $4,470 | $99,060 | $14,550 | $84,510 |
| 2023 | $4,440 | $92,470 | $14,550 | $77,920 |
| 2022 | $3,510 | $68,960 | $14,550 | $54,410 |
| 2021 | $3,382 | $68,960 | $14,550 | $54,410 |
| 2020 | $3,503 | $68,960 | $14,550 | $54,410 |
| 2019 | $4,201 | $61,270 | $15,280 | $45,990 |
| 2018 | $3,360 | $61,270 | $15,280 | $45,990 |
| 2017 | $3,431 | $61,270 | $15,280 | $45,990 |
| 2016 | $3,204 | $54,970 | $15,280 | $39,690 |
| 2015 | $3,168 | $54,970 | $15,280 | $39,690 |
| 2014 | $2,815 | $54,970 | $15,280 | $39,690 |
| 2013 | $2,815 | $49,240 | $10,190 | $39,050 |
Source: Public Records
Map
Nearby Homes
- 375 Woodsdale Dr
- 280 Stillpass Way
- 110 Stonemill Ct
- 15 Old Orchard Ln
- 858 S Main St
- 965 Redfox Ct
- 7921 Victory Garden Ln
- 5752 Sunrise View Cir
- 145 Stablewatch Ct
- 7784 Summerlin Blvd
- 265 Woodyard Dr
- 7891 Celestial Cir
- 3 Lebanon St
- 513 Austin Smith Dr
- 230 Meadowlark Ln
- 32 W Elm St
- 155 Keswick Dr
- 325 Easton Manor Dr
- 6893 Gaspar Trail
- 1 Kyles Station Rd
- 30 Forest View Ct
- 50 Forest View Ct
- 35 Meadowlands Dr
- 55 Meadowlands Dr
- 10 Forest View Ct
- 45 Forest View Ct
- 55 Forest View Ct
- 35 Forest View Ct
- 850 Helsinger Dr
- 860 Helsinger Dr
- 25 Forest View Ct
- 840 Helsinger Dr
- 25 Meadowlands Dr
- 870 Helsinger Dr
- 830 Helsinger Dr
- 250 Woodsdale Dr
- 880 Helsinger Dr
- 895 Helsinger Dr
- 240 Woodsdale Dr
- 864 Tam o Shanter Way
Your Personal Tour Guide
Ask me questions while you tour the home.