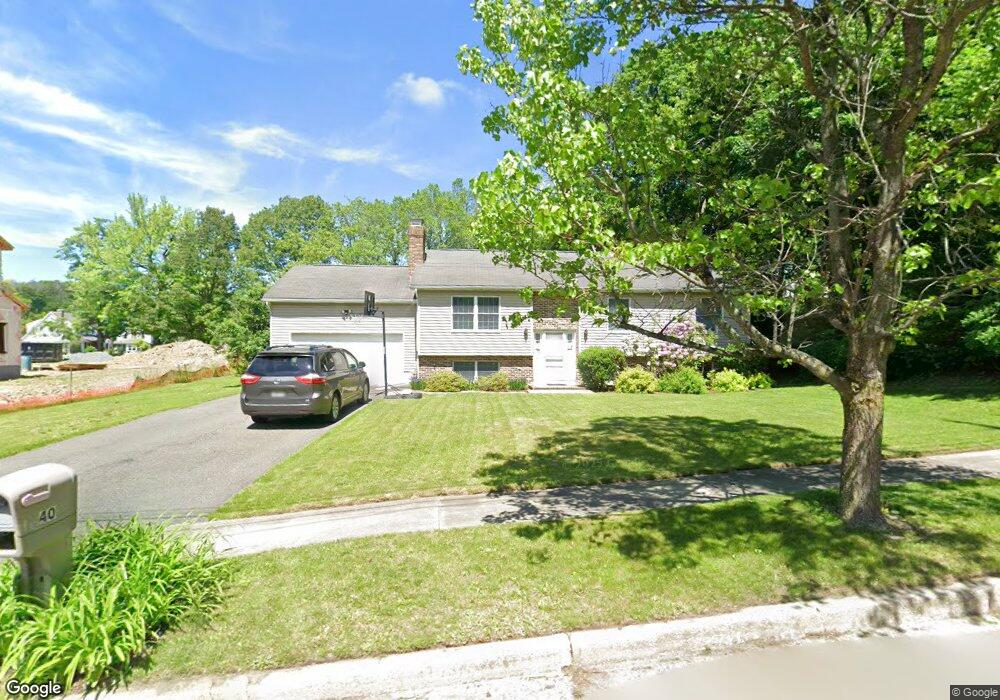
40 Foster St Newton, NJ 07860
Estimated Value: $497,000 - $545,000
--
Bed
--
Bath
2,496
Sq Ft
$210/Sq Ft
Est. Value
About This Home
This home is located at 40 Foster St, Newton, NJ 07860 and is currently estimated at $523,614, approximately $209 per square foot. 40 Foster St is a home located in Sussex County with nearby schools including Merriam Avenue School, Halsted Street Middle School, and Newton High School.
Ownership History
Date
Name
Owned For
Owner Type
Purchase Details
Closed on
Jan 27, 1998
Sold by
Leto Michael V and Leto Gloria J
Bought by
Guziewicz Ii Joseph C and Guziewicz Angela
Current Estimated Value
Home Financials for this Owner
Home Financials are based on the most recent Mortgage that was taken out on this home.
Original Mortgage
$104,000
Outstanding Balance
$18,444
Interest Rate
7.02%
Estimated Equity
$505,170
Purchase Details
Closed on
Dec 13, 1996
Sold by
Trinca Joseph
Bought by
Leto Michael and Leto Gloria J
Home Financials for this Owner
Home Financials are based on the most recent Mortgage that was taken out on this home.
Original Mortgage
$142,200
Interest Rate
7%
Create a Home Valuation Report for This Property
The Home Valuation Report is an in-depth analysis detailing your home's value as well as a comparison with similar homes in the area
Home Values in the Area
Average Home Value in this Area
Purchase History
| Date | Buyer | Sale Price | Title Company |
|---|---|---|---|
| Guziewicz Ii Joseph C | $158,500 | -- | |
| Leto Michael | $158,000 | -- |
Source: Public Records
Mortgage History
| Date | Status | Borrower | Loan Amount |
|---|---|---|---|
| Open | Guziewicz Ii Joseph C | $104,000 | |
| Previous Owner | Leto Michael | $142,200 |
Source: Public Records
Tax History Compared to Growth
Tax History
| Year | Tax Paid | Tax Assessment Tax Assessment Total Assessment is a certain percentage of the fair market value that is determined by local assessors to be the total taxable value of land and additions on the property. | Land | Improvement |
|---|---|---|---|---|
| 2025 | $13,002 | $498,300 | $96,700 | $401,600 |
| 2024 | $13,033 | $476,800 | $82,300 | $394,500 |
| 2023 | $13,033 | $290,000 | $77,300 | $212,700 |
| 2022 | $13,085 | $290,000 | $77,300 | $212,700 |
| 2021 | $13,027 | $290,000 | $77,300 | $212,700 |
| 2020 | $12,827 | $290,000 | $77,300 | $212,700 |
| 2019 | $12,429 | $290,000 | $77,300 | $212,700 |
| 2018 | $12,363 | $290,000 | $77,300 | $212,700 |
| 2017 | $12,290 | $290,000 | $77,300 | $212,700 |
| 2016 | $12,093 | $290,000 | $77,300 | $212,700 |
| 2015 | $11,774 | $290,000 | $77,300 | $212,700 |
| 2014 | $11,530 | $290,000 | $77,300 | $212,700 |
Source: Public Records
Map
Nearby Homes
- 37 Foster St
- 13 Summit Ave
- 5 Clarkson St
- 9 Lawnwood Ave
- 67 Ryerson Ave
- 0 W Nelson St
- 15 Cherry St
- 7 Cherry St
- 5 Jefferson St
- 22 Woodside Ave
- 76 Carriage Ln Unit 76
- 32 Trinity St
- 252 Spring St
- 37 Park Ave
- 40 Carriage Ln Unit 40
- 21 Carriage Ln Unit 21
- 103 Woodside Ave
- 52 Trinity St
- 5 Babbitt Ct
- 3 Townsend St