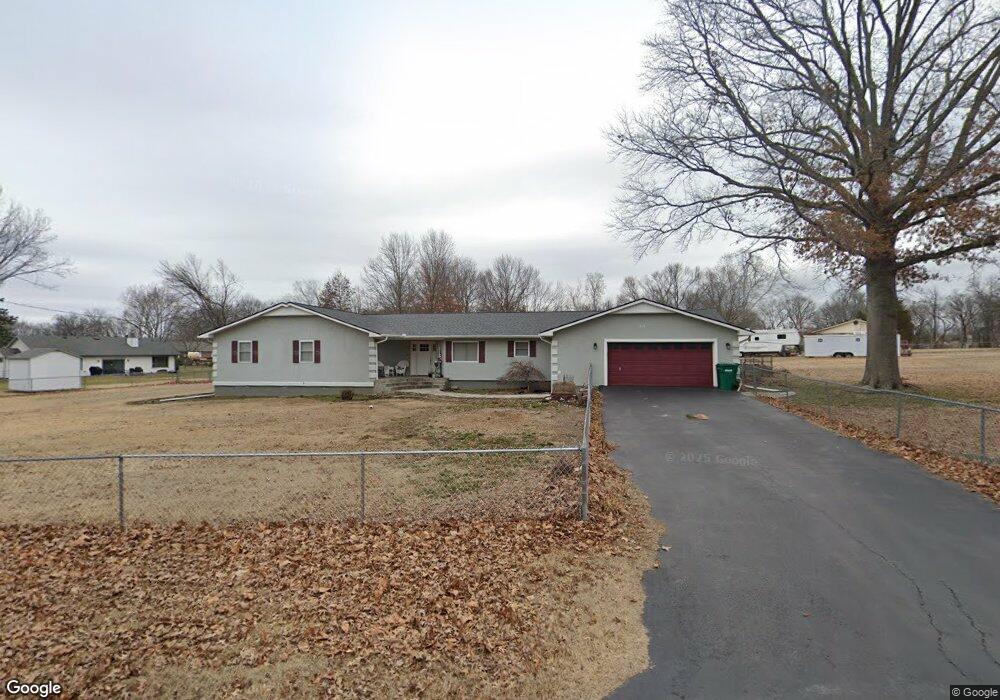
40 Fox Run Rogers, AR 72756
Estimated Value: $379,532 - $471,000
--
Bed
2
Baths
2,304
Sq Ft
$178/Sq Ft
Est. Value
About This Home
This home is located at 40 Fox Run, Rogers, AR 72756 and is currently estimated at $409,883, approximately $177 per square foot. 40 Fox Run is a home located in Benton County with nearby schools including Northside Elementary School, Lingle Middle School, and Rogers Heritage High School.
Ownership History
Date
Name
Owned For
Owner Type
Purchase Details
Closed on
Sep 1, 2020
Sold by
Russell D Anderson Trust and Mary C Anderson Trust
Bought by
Anderson Mary Charlene
Current Estimated Value
Purchase Details
Closed on
Aug 28, 2020
Sold by
Anderson Russell D
Bought by
Anderson Mary Charlene
Purchase Details
Closed on
Oct 19, 1998
Bought by
Anderson Trusts
Purchase Details
Closed on
Oct 12, 1998
Bought by
Anderson Tr
Purchase Details
Closed on
Apr 9, 1984
Bought by
Anderson
Create a Home Valuation Report for This Property
The Home Valuation Report is an in-depth analysis detailing your home's value as well as a comparison with similar homes in the area
Home Values in the Area
Average Home Value in this Area
Purchase History
| Date | Buyer | Sale Price | Title Company |
|---|---|---|---|
| Anderson Mary Charlene | -- | None Listed On Document | |
| Anderson Mary Charlene | -- | None Available | |
| Anderson Trusts | -- | -- | |
| Anderson Tr | -- | -- | |
| Anderson | $80,000 | -- |
Source: Public Records
Tax History Compared to Growth
Tax History
| Year | Tax Paid | Tax Assessment Tax Assessment Total Assessment is a certain percentage of the fair market value that is determined by local assessors to be the total taxable value of land and additions on the property. | Land | Improvement |
|---|---|---|---|---|
| 2025 | $1,473 | $71,291 | $8,600 | $62,691 |
| 2024 | $1,437 | $71,291 | $8,600 | $62,691 |
| 2023 | $1,437 | $48,670 | $8,600 | $40,070 |
| 2022 | $1,119 | $48,670 | $8,600 | $40,070 |
| 2021 | $1,116 | $48,670 | $8,600 | $40,070 |
| 2020 | $1,117 | $27,170 | $3,800 | $23,370 |
| 2019 | $1,117 | $27,170 | $3,800 | $23,370 |
| 2018 | $1,142 | $27,170 | $3,800 | $23,370 |
| 2017 | $1,060 | $27,170 | $3,800 | $23,370 |
| 2016 | $1,060 | $27,170 | $3,800 | $23,370 |
| 2015 | $1,464 | $27,680 | $5,000 | $22,680 |
| 2014 | $1,114 | $27,680 | $5,000 | $22,680 |
Source: Public Records
Map
Nearby Homes
- 5219 Joe Ln
- 5213 Joe Ln
- 12400 Wildwood Dr
- 12437 Wildwood Dr
- 95 Kemper Place
- Tracts A/B N 94 Hwy
- 22 Howard Place
- 000 Peck Rd
- 6010 Ln
- 518 W Brush Creek Dr
- 5539 Arkansas 94
- 1201 Bunker Dr
- 11511 Landers Rd
- 11511 & 11503 Landers Rd
- 989 Red Cedar Place
- 202 Buttry Rd
- 2612 Fairway Cir
- 959 Nadine Dr
- HOLDEN Plan at Tall Tree
- GARLAND Plan at Tall Tree
- 41 Fox Run
- 42 Woodridge Rd
- 71 Fox Run
- 70 Woodridge Rd
- 33 Killdeer Rd
- 39 Woodridge Rd
- 32 Fox Run
- 34 Killdeer Rd
- 72 Woodridge Rd
- 72 N Woodridge Rd
- 69 Woodridge Rd
- 43 Woodridge Rd
- 38 Woodridge Rd
- 31 Killdeer Rd
- 35 Killdeer Rd
- 73 Woodridge Rd
- 68 Woodridge Rd
- 78 Briarwood Rd
- 79 Briarwood Rd
- 4 Killdeer Rd