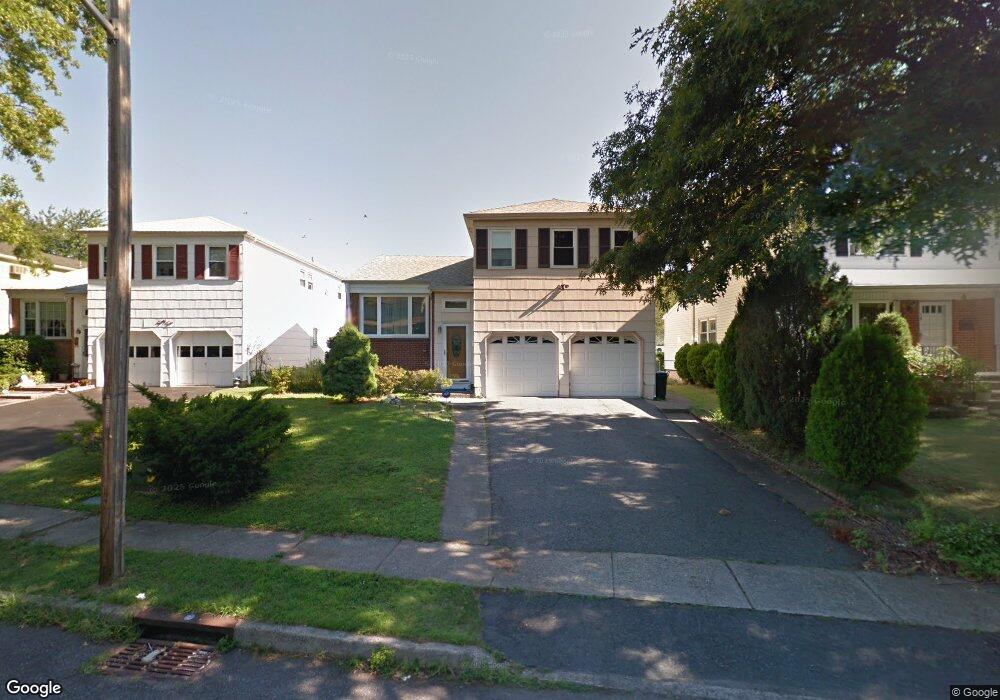
40 George St Bloomfield, NJ 07003
Estimated Value: $637,816 - $775,000
--
Bed
--
Bath
1,789
Sq Ft
$378/Sq Ft
Est. Value
About This Home
This home is located at 40 George St, Bloomfield, NJ 07003 and is currently estimated at $676,704, approximately $378 per square foot. 40 George St is a home located in Essex County with nearby schools including Demarest School, Bloomfield Middle School, and Bloomfield High School.
Ownership History
Date
Name
Owned For
Owner Type
Purchase Details
Closed on
Jul 24, 1998
Sold by
Yanker Casper
Bought by
Umali Rufino C and Umali Luisa Nida L
Current Estimated Value
Home Financials for this Owner
Home Financials are based on the most recent Mortgage that was taken out on this home.
Original Mortgage
$180,500
Outstanding Balance
$36,906
Interest Rate
6.99%
Estimated Equity
$639,798
Purchase Details
Closed on
Apr 27, 1989
Sold by
Lewandowski Witold and Lewandowski Elizbieta
Bought by
Yanker Casper and Yanker Barbara
Create a Home Valuation Report for This Property
The Home Valuation Report is an in-depth analysis detailing your home's value as well as a comparison with similar homes in the area
Home Values in the Area
Average Home Value in this Area
Purchase History
| Date | Buyer | Sale Price | Title Company |
|---|---|---|---|
| Umali Rufino C | $190,000 | -- | |
| Yanker Casper | $226,900 | -- |
Source: Public Records
Mortgage History
| Date | Status | Borrower | Loan Amount |
|---|---|---|---|
| Open | Umali Rufino C | $180,500 |
Source: Public Records
Tax History Compared to Growth
Tax History
| Year | Tax Paid | Tax Assessment Tax Assessment Total Assessment is a certain percentage of the fair market value that is determined by local assessors to be the total taxable value of land and additions on the property. | Land | Improvement |
|---|---|---|---|---|
| 2025 | $13,614 | $416,600 | $173,800 | $242,800 |
| 2024 | $13,614 | $416,600 | $173,800 | $242,800 |
| 2022 | $13,340 | $416,600 | $173,800 | $242,800 |
| 2021 | $13,094 | $416,600 | $173,800 | $242,800 |
| 2020 | $12,894 | $416,600 | $173,800 | $242,800 |
| 2019 | $13,603 | $341,700 | $165,000 | $176,700 |
| 2018 | $13,545 | $341,700 | $165,000 | $176,700 |
| 2017 | $13,340 | $341,700 | $165,000 | $176,700 |
| 2016 | $13,190 | $341,700 | $165,000 | $176,700 |
| 2015 | $13,070 | $341,700 | $165,000 | $176,700 |
| 2014 | $12,831 | $341,700 | $165,000 | $176,700 |
Source: Public Records
Map
Nearby Homes