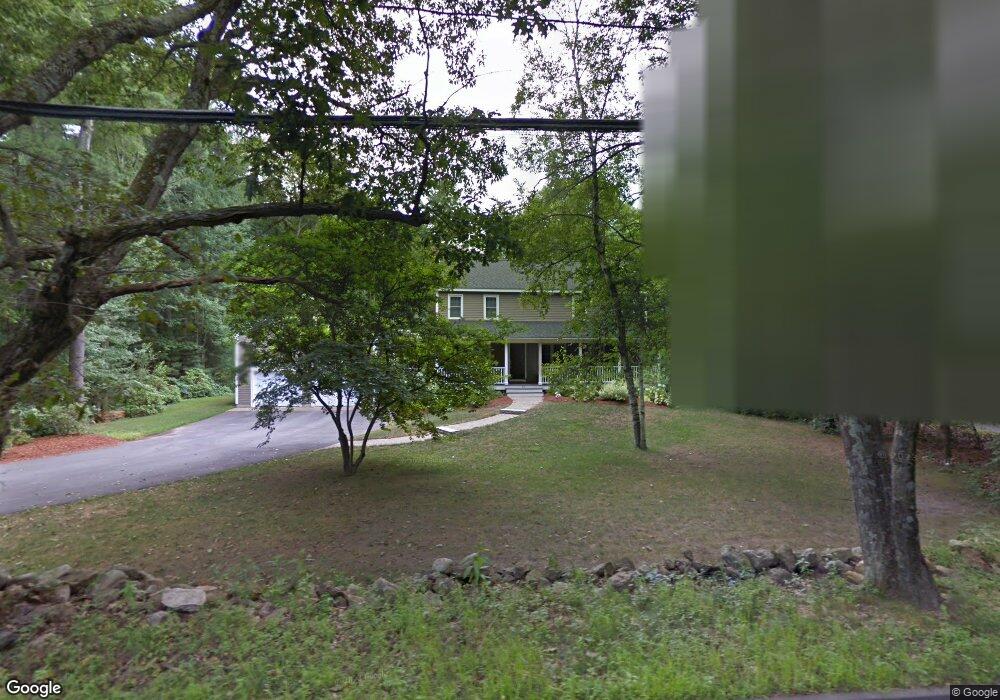
40 Goodale Rd Marlborough, MA 01752
Estimated Value: $788,000 - $1,026,000
6
Beds
4
Baths
3,317
Sq Ft
$279/Sq Ft
Est. Value
About This Home
This home is located at 40 Goodale Rd, Marlborough, MA 01752 and is currently estimated at $924,029, approximately $278 per square foot. 40 Goodale Rd is a home located in Middlesex County with nearby schools including Marlborough High School, New Covenant Christian School, and Glenhaven Academy - JRI School.
Ownership History
Date
Name
Owned For
Owner Type
Purchase Details
Closed on
May 29, 1998
Sold by
Harpin Peter B
Bought by
Berber Peter J
Current Estimated Value
Home Financials for this Owner
Home Financials are based on the most recent Mortgage that was taken out on this home.
Original Mortgage
$113,900
Outstanding Balance
$22,925
Interest Rate
7.12%
Mortgage Type
Purchase Money Mortgage
Estimated Equity
$901,104
Create a Home Valuation Report for This Property
The Home Valuation Report is an in-depth analysis detailing your home's value as well as a comparison with similar homes in the area
Home Values in the Area
Average Home Value in this Area
Purchase History
| Date | Buyer | Sale Price | Title Company |
|---|---|---|---|
| Berber Peter J | $134,000 | -- |
Source: Public Records
Mortgage History
| Date | Status | Borrower | Loan Amount |
|---|---|---|---|
| Open | Berber Peter J | $113,900 | |
| Previous Owner | Berber Peter J | $98,250 | |
| Previous Owner | Berber Peter J | $40,000 |
Source: Public Records
Tax History Compared to Growth
Tax History
| Year | Tax Paid | Tax Assessment Tax Assessment Total Assessment is a certain percentage of the fair market value that is determined by local assessors to be the total taxable value of land and additions on the property. | Land | Improvement |
|---|---|---|---|---|
| 2025 | $8,534 | $865,500 | $238,100 | $627,400 |
| 2024 | $8,016 | $782,800 | $216,400 | $566,400 |
| 2023 | $8,185 | $709,300 | $187,200 | $522,100 |
| 2022 | $7,888 | $601,200 | $178,500 | $422,700 |
| 2021 | $7,725 | $559,800 | $148,800 | $411,000 |
| 2020 | $7,589 | $535,200 | $141,800 | $393,400 |
| 2019 | $7,330 | $521,000 | $139,200 | $381,800 |
| 2018 | $13,178 | $502,700 | $128,000 | $374,700 |
| 2017 | $7,626 | $497,800 | $130,300 | $367,500 |
| 2016 | $7,563 | $493,000 | $130,300 | $362,700 |
| 2015 | $7,869 | $499,300 | $134,000 | $365,300 |
Source: Public Records
Map
Nearby Homes