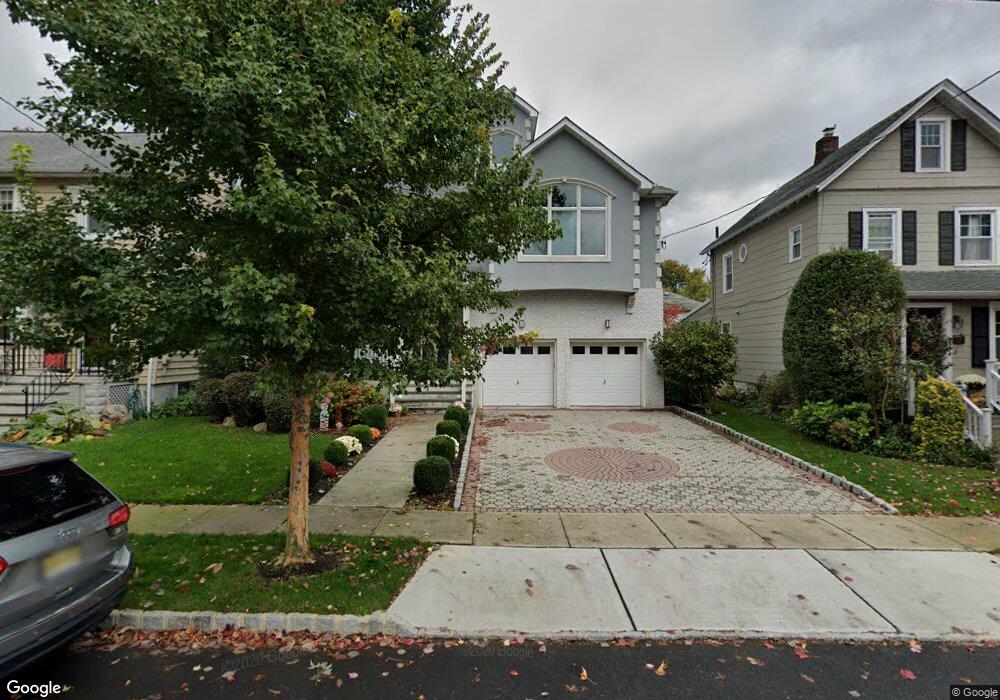
40 Gray St Montclair, NJ 07042
Estimated Value: $1,604,000 - $1,661,000
Studio
--
Bath
3,286
Sq Ft
$494/Sq Ft
Est. Value
About This Home
This home is located at 40 Gray St, Montclair, NJ 07042 and is currently estimated at $1,622,245, approximately $493 per square foot. 40 Gray St is a home located in Essex County with nearby schools including Hillside School, Nishuane School, and Bradford School.
Ownership History
Date
Name
Owned For
Owner Type
Purchase Details
Closed on
Dec 13, 2011
Sold by
Milici Jacqueline and Weinstein Mark E
Bought by
Patel Ashish B and Patel Shivani
Current Estimated Value
Purchase Details
Closed on
Jul 15, 2005
Sold by
Rica Enterprises Inc
Bought by
Weinstein Mark and Milici Jacqueline
Home Financials for this Owner
Home Financials are based on the most recent Mortgage that was taken out on this home.
Original Mortgage
$500,000
Interest Rate
5.5%
Mortgage Type
Adjustable Rate Mortgage/ARM
Create a Home Valuation Report for This Property
The Home Valuation Report is an in-depth analysis detailing your home's value as well as a comparison with similar homes in the area
Home Values in the Area
Average Home Value in this Area
Purchase History
| Date | Buyer | Sale Price | Title Company |
|---|---|---|---|
| Patel Ashish B | $625,000 | Chicago Title | |
| Weinstein Mark | $675,000 | -- |
Source: Public Records
Mortgage History
| Date | Status | Borrower | Loan Amount |
|---|---|---|---|
| Previous Owner | Weinstein Mark | $500,000 |
Source: Public Records
Tax History
| Year | Tax Paid | Tax Assessment Tax Assessment Total Assessment is a certain percentage of the fair market value that is determined by local assessors to be the total taxable value of land and additions on the property. | Land | Improvement |
|---|---|---|---|---|
| 2025 | $26,081 | $766,400 | $325,500 | $440,900 |
| 2024 | $25,904 | $766,400 | $325,500 | $440,900 |
| 2022 | $25,199 | $766,400 | $325,500 | $440,900 |
| 2021 | $24,762 | $766,400 | $325,500 | $440,900 |
| 2020 | $24,364 | $766,400 | $325,500 | $440,900 |
| 2019 | $24,111 | $766,400 | $325,500 | $440,900 |
| 2018 | $23,712 | $766,400 | $325,500 | $440,900 |
| 2017 | $23,535 | $630,300 | $276,000 | $354,300 |
| 2016 | $22,905 | $630,300 | $276,000 | $354,300 |
| 2015 | $22,224 | $630,300 | $276,000 | $354,300 |
| 2014 | $21,481 | $630,300 | $276,000 | $354,300 |
Source: Public Records
Map
Nearby Homes
- 3 Christopher Ct
- 9 Glenfield Rd
- 58 Yantecaw Ave
- 41 Glenridge Ave Unit 2L
- 281 Forest Ave
- 15 Poe Ave
- 9 Mount Vernon Rd
- 17 Glen Ridge Pkwy
- 256 Forest Ave
- 381 Essex Ave
- 14 Davidson Rd
- 163 Park St
- 371 Essex Ave
- 197 N Fullerton Ave
- 82 Watchung Ave Unit 84
- 470 Valley Rd Unit C003A
- 68 Bell St
- 5 Inness Place
- 1169 Broad St
- 412 Ridgewood Ave
Your Personal Tour Guide
Ask me questions while you tour the home.