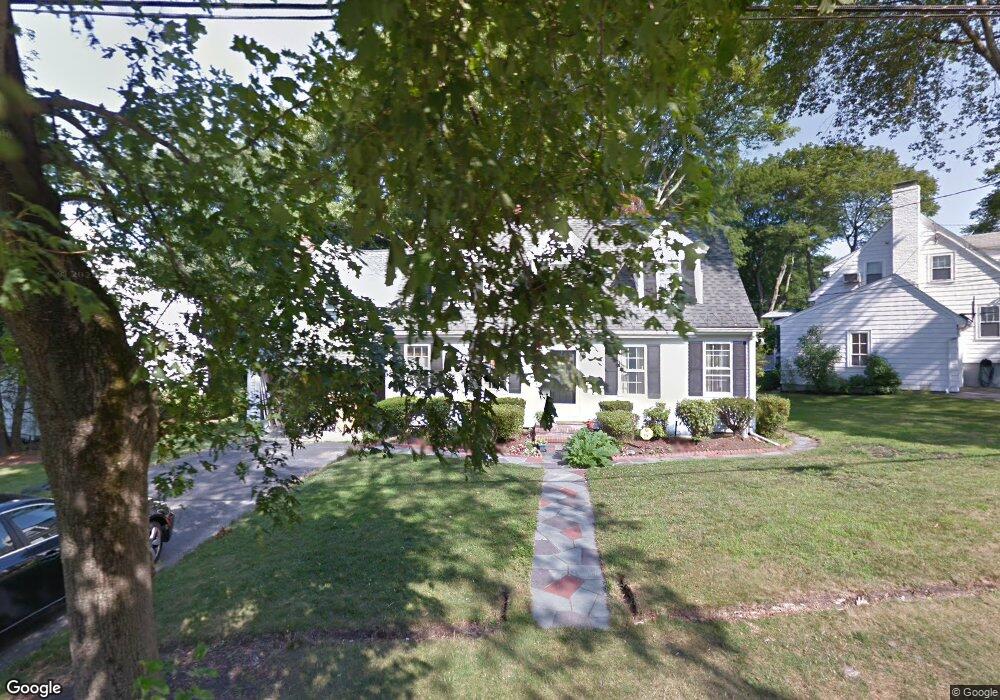
40 Hagen Rd Newton Center, MA 02459
Thompsonville NeighborhoodEstimated Value: $1,653,486 - $1,828,000
4
Beds
3
Baths
2,494
Sq Ft
$700/Sq Ft
Est. Value
About This Home
This home is located at 40 Hagen Rd, Newton Center, MA 02459 and is currently estimated at $1,746,122, approximately $700 per square foot. 40 Hagen Rd is a home located in Middlesex County with nearby schools including Bowen School, Countryside Elementary School, and Charles E Brown Middle School.
Ownership History
Date
Name
Owned For
Owner Type
Purchase Details
Closed on
Sep 1, 2004
Sold by
Brenner Ash Jennifer and Ash Ronald A
Bought by
Kadiyala Irina N and Kadiyala Sudhakar
Current Estimated Value
Home Financials for this Owner
Home Financials are based on the most recent Mortgage that was taken out on this home.
Original Mortgage
$650,000
Interest Rate
6.01%
Mortgage Type
Purchase Money Mortgage
Purchase Details
Closed on
Jul 20, 2001
Sold by
Stoller Judith Y
Bought by
Ash Ronald A and Brenneash Jennifer
Home Financials for this Owner
Home Financials are based on the most recent Mortgage that was taken out on this home.
Original Mortgage
$540,000
Interest Rate
7.2%
Mortgage Type
Purchase Money Mortgage
Create a Home Valuation Report for This Property
The Home Valuation Report is an in-depth analysis detailing your home's value as well as a comparison with similar homes in the area
Home Values in the Area
Average Home Value in this Area
Purchase History
| Date | Buyer | Sale Price | Title Company |
|---|---|---|---|
| Kadiyala Irina N | $875,000 | -- | |
| Ash Ronald A | $790,000 | -- |
Source: Public Records
Mortgage History
| Date | Status | Borrower | Loan Amount |
|---|---|---|---|
| Open | Ash Ronald A | $523,750 | |
| Closed | Kadiyala Irina N | $650,000 | |
| Previous Owner | Ash Ronald A | $540,000 | |
| Previous Owner | Ash Ronald A | $400,000 |
Source: Public Records
Tax History Compared to Growth
Tax History
| Year | Tax Paid | Tax Assessment Tax Assessment Total Assessment is a certain percentage of the fair market value that is determined by local assessors to be the total taxable value of land and additions on the property. | Land | Improvement |
|---|---|---|---|---|
| 2025 | $13,223 | $1,349,300 | $899,000 | $450,300 |
| 2024 | $12,786 | $1,310,000 | $872,800 | $437,200 |
| 2023 | $12,176 | $1,196,100 | $665,100 | $531,000 |
| 2022 | $11,651 | $1,107,500 | $615,800 | $491,700 |
| 2021 | $11,242 | $1,044,800 | $580,900 | $463,900 |
| 2020 | $10,844 | $1,038,700 | $580,900 | $457,800 |
| 2019 | $10,538 | $1,008,400 | $564,000 | $444,400 |
| 2018 | $10,221 | $944,600 | $511,900 | $432,700 |
| 2017 | $9,909 | $891,100 | $482,900 | $408,200 |
| 2016 | $9,477 | $832,800 | $451,300 | $381,500 |
| 2015 | $9,036 | $778,300 | $421,800 | $356,500 |
Source: Public Records
Map
Nearby Homes