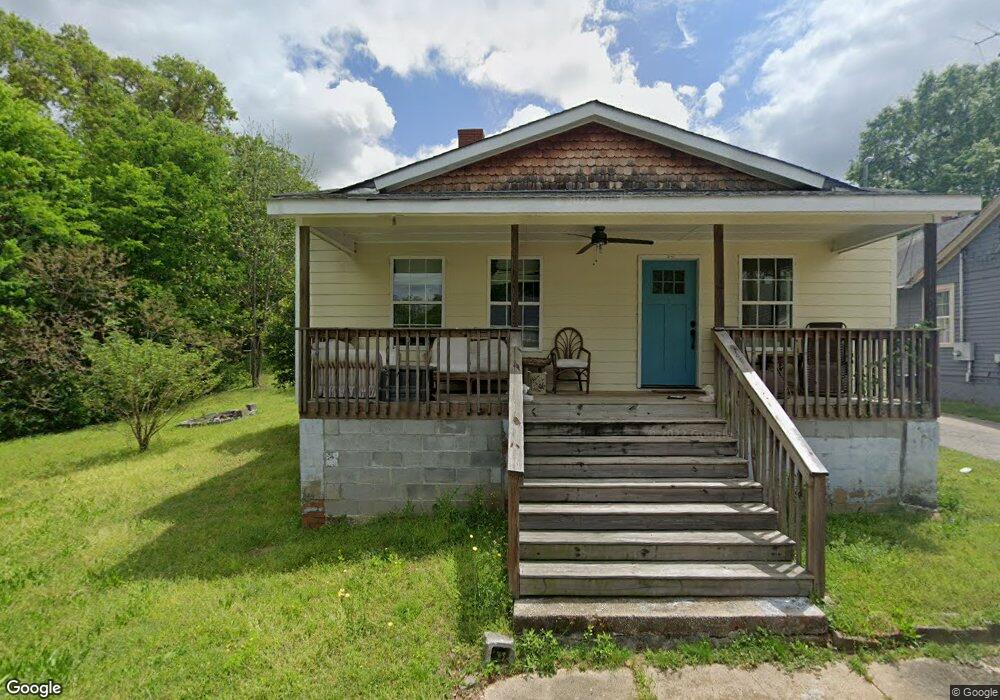
40 Hazel St Porterdale, GA 30014
Estimated Value: $137,411 - $188,000
2
Beds
2
Baths
1,192
Sq Ft
$135/Sq Ft
Est. Value
About This Home
This home is located at 40 Hazel St, Porterdale, GA 30014 and is currently estimated at $160,353, approximately $134 per square foot. 40 Hazel St is a home located in Newton County with nearby schools including Middle Ridge Elementary School, Clements Middle School, and Newton High School.
Ownership History
Date
Name
Owned For
Owner Type
Purchase Details
Closed on
Aug 15, 2023
Sold by
Bomeadow Properties Llc
Bought by
Dickerson Homes Llc
Current Estimated Value
Home Financials for this Owner
Home Financials are based on the most recent Mortgage that was taken out on this home.
Original Mortgage
$100,000
Outstanding Balance
$69,766
Interest Rate
6.78%
Mortgage Type
New Conventional
Estimated Equity
$90,587
Purchase Details
Closed on
Mar 4, 2019
Sold by
Brooks James Aaron
Bought by
Bomeadow Properties Llc
Create a Home Valuation Report for This Property
The Home Valuation Report is an in-depth analysis detailing your home's value as well as a comparison with similar homes in the area
Home Values in the Area
Average Home Value in this Area
Purchase History
| Date | Buyer | Sale Price | Title Company |
|---|---|---|---|
| Dickerson Homes Llc | $100,000 | -- | |
| Bomeadow Properties Llc | $65,000 | -- |
Source: Public Records
Mortgage History
| Date | Status | Borrower | Loan Amount |
|---|---|---|---|
| Open | Dickerson Homes Llc | $100,000 |
Source: Public Records
Tax History Compared to Growth
Tax History
| Year | Tax Paid | Tax Assessment Tax Assessment Total Assessment is a certain percentage of the fair market value that is determined by local assessors to be the total taxable value of land and additions on the property. | Land | Improvement |
|---|---|---|---|---|
| 2024 | $2,368 | $60,360 | $10,000 | $50,360 |
| 2023 | $2,201 | $53,520 | $5,600 | $47,920 |
| 2022 | $1,848 | $44,920 | $5,600 | $39,320 |
| 2021 | $1,621 | $36,520 | $5,600 | $30,920 |
| 2020 | $898 | $26,720 | $5,600 | $21,120 |
| 2019 | $736 | $25,480 | $5,600 | $19,880 |
| 2018 | $334 | $23,360 | $5,600 | $17,760 |
| 2017 | $420 | $16,120 | $3,200 | $12,920 |
| 2016 | $332 | $9,680 | $3,200 | $6,480 |
| 2015 | $8 | $9,640 | $3,200 | $6,440 |
| 2014 | $4 | $10,040 | $0 | $0 |
Source: Public Records
Map
Nearby Homes