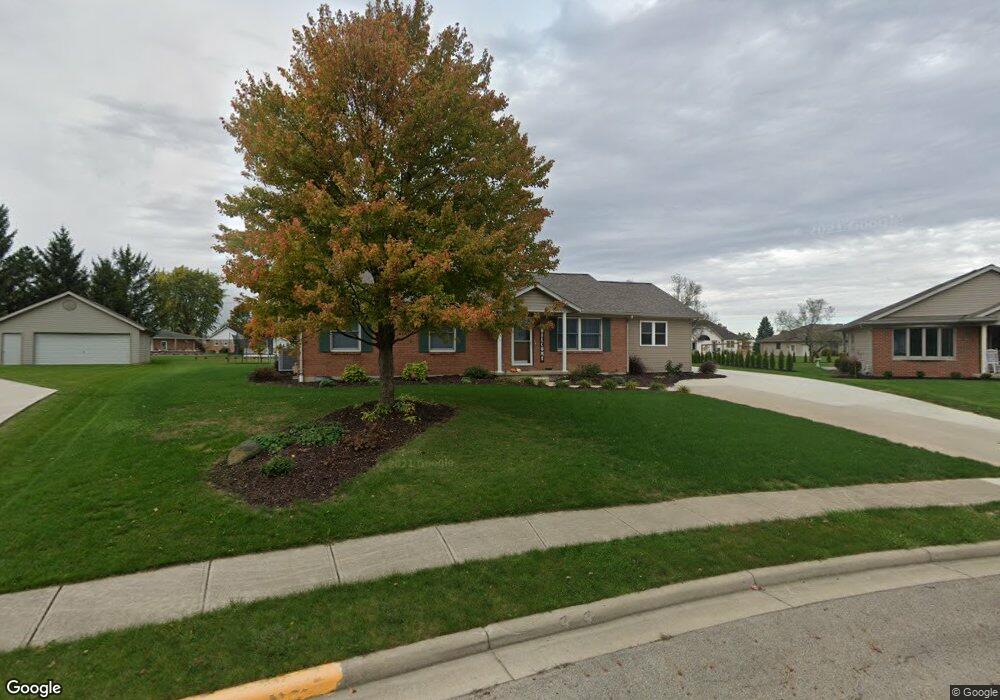
40 Hickory Dr Fort Loramie, OH 45845
Estimated Value: $315,000 - $457,160
4
Beds
3
Baths
2,038
Sq Ft
$198/Sq Ft
Est. Value
About This Home
This home is located at 40 Hickory Dr, Fort Loramie, OH 45845 and is currently estimated at $404,540, approximately $198 per square foot. 40 Hickory Dr is a home located in Shelby County with nearby schools including Fort Loramie Elementary School, Fort Loramie Junior/Senior High School, and St Augustine Religious School.
Ownership History
Date
Name
Owned For
Owner Type
Purchase Details
Closed on
Sep 13, 2013
Sold by
Bergman Craig A and Bergman Abby C
Bought by
Ahrns Jerome L and Wenning Melissa A
Current Estimated Value
Home Financials for this Owner
Home Financials are based on the most recent Mortgage that was taken out on this home.
Original Mortgage
$104,000
Outstanding Balance
$76,115
Interest Rate
4.38%
Mortgage Type
New Conventional
Estimated Equity
$328,425
Purchase Details
Closed on
Feb 11, 2005
Sold by
Barlage Allen A and Barlage Odyne L
Bought by
Bergman Craig A
Home Financials for this Owner
Home Financials are based on the most recent Mortgage that was taken out on this home.
Original Mortgage
$111,964
Interest Rate
5.75%
Mortgage Type
Purchase Money Mortgage
Purchase Details
Closed on
Jan 17, 1997
Sold by
Drees John J
Bought by
Barlage Allen A and Barlage Odyne L
Create a Home Valuation Report for This Property
The Home Valuation Report is an in-depth analysis detailing your home's value as well as a comparison with similar homes in the area
Purchase History
| Date | Buyer | Sale Price | Title Company |
|---|---|---|---|
| Ahrns Jerome L | $130,000 | Attorney | |
| Bergman Craig A | $117,000 | None Available | |
| Barlage Allen A | $19,500 | -- |
Source: Public Records
Mortgage History
| Date | Status | Borrower | Loan Amount |
|---|---|---|---|
| Open | Ahrns Jerome L | $104,000 | |
| Previous Owner | Bergman Craig A | $111,964 |
Source: Public Records
Tax History
| Year | Tax Paid | Tax Assessment Tax Assessment Total Assessment is a certain percentage of the fair market value that is determined by local assessors to be the total taxable value of land and additions on the property. | Land | Improvement |
|---|---|---|---|---|
| 2025 | $4,523 | $131,370 | $14,000 | $117,370 |
| 2024 | $4,523 | $131,370 | $14,000 | $117,370 |
| 2023 | $4,656 | $131,370 | $14,000 | $117,370 |
| 2022 | $3,719 | $96,270 | $10,180 | $86,090 |
| 2021 | $2,539 | $65,050 | $10,180 | $54,870 |
| 2020 | $2,550 | $65,330 | $10,180 | $55,150 |
| 2019 | $2,189 | $56,280 | $8,480 | $47,800 |
| 2018 | $2,138 | $56,280 | $8,480 | $47,800 |
| 2017 | $2,305 | $56,280 | $8,480 | $47,800 |
| 2016 | $1,876 | $47,900 | $7,640 | $40,260 |
| 2015 | $1,861 | $47,900 | $7,640 | $40,260 |
| 2014 | $1,861 | $47,900 | $7,640 | $40,260 |
| 2013 | $1,986 | $45,980 | $7,640 | $38,340 |
Source: Public Records
Map
Nearby Homes
- 8381 Ohio 66
- 10 W Main St
- 4221 State Route 362
- 5761 Fisher & Koverman Rd
- 7 E 2nd St
- 123 S Hamilton St
- 1991 Minster Egypt Pike
- 0 Stonegate Dr Unit 14 10544847
- 0 Stonegate Dr Unit 21 10544857
- 17 Stonegate Dr
- 36 Shania Place Unit 23
- 28 Shania Place Unit 33
- 19 Shania Place Unit 33
- 27 Shania Place Unit 26
- 11968 Arling Rd
- 610 S Walnut St
- 561 S Walnut St Unit Lot3
- 419 Canal St
- 6388 Stoker Rd
- 149 Janice Dr
Your Personal Tour Guide
Ask me questions while you tour the home.