Estimated Value: $335,953 - $395,000
3
Beds
3
Baths
1,926
Sq Ft
$192/Sq Ft
Est. Value
About This Home
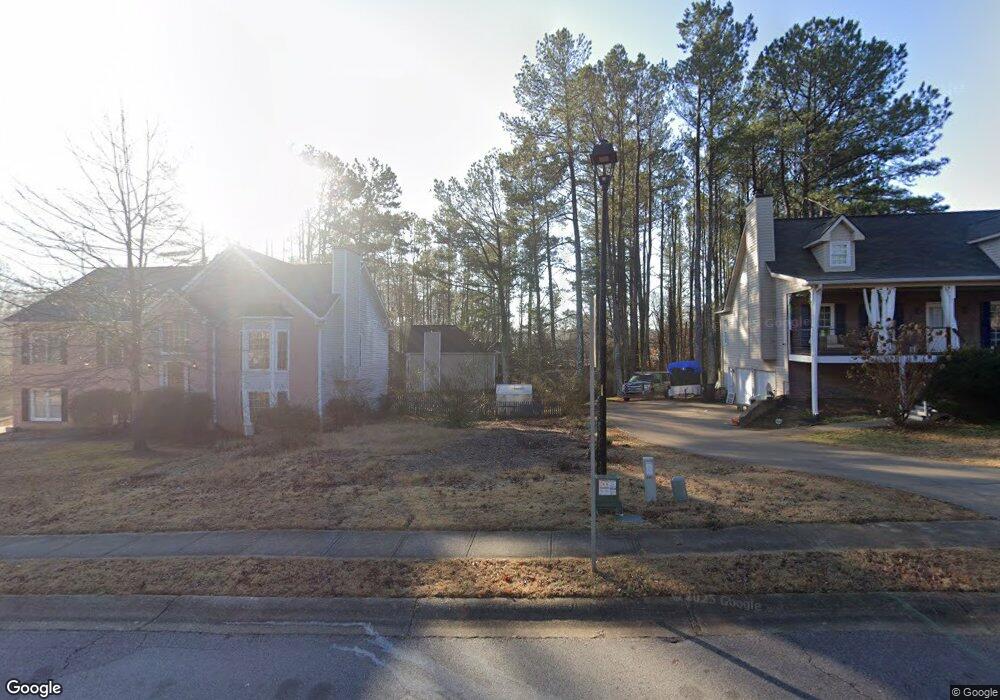
This home is located at 40 Hollow Springs Dr, Hiram, GA 30141 and is currently estimated at $368,988, approximately $191 per square foot. 40 Hollow Springs Dr is a home located in Paulding County with nearby schools including Hal Hutchens Elementary School, Irma C. Austin Middle School, and Hiram High School.
Ownership History
Date
Name
Owned For
Owner Type
Purchase Details
Closed on
Jul 29, 2016
Sold by
Belinda B
Bought by
Haddle Brian and Ki Young
Current Estimated Value
Home Financials for this Owner
Home Financials are based on the most recent Mortgage that was taken out on this home.
Original Mortgage
$185,940
Outstanding Balance
$148,358
Interest Rate
3.48%
Estimated Equity
$220,630
Purchase Details
Closed on
Jan 30, 2012
Sold by
Harding Ronald C
Bought by
Harding Belinda B
Purchase Details
Closed on
Jan 6, 2012
Sold by
Harding Ronald C
Bought by
Harding Ronald C and Harding Belinda B
Purchase Details
Closed on
Mar 7, 1997
Sold by
Reidinc Bromley
Bought by
Harding Ronald
Create a Home Valuation Report for This Property
The Home Valuation Report is an in-depth analysis detailing your home's value as well as a comparison with similar homes in the area
Home Values in the Area
Average Home Value in this Area
Purchase History
| Date | Buyer | Sale Price | Title Company |
|---|---|---|---|
| Haddle Brian | $186,500 | -- | |
| Harding Belinda B | -- | -- | |
| Harding Ronald C | -- | -- | |
| Harding Ronald | $132,100 | -- |
Source: Public Records
Mortgage History
| Date | Status | Borrower | Loan Amount |
|---|---|---|---|
| Open | Haddle Brian | $185,940 | |
| Closed | Harding Ronald | $0 |
Source: Public Records
Tax History Compared to Growth
Tax History
| Year | Tax Paid | Tax Assessment Tax Assessment Total Assessment is a certain percentage of the fair market value that is determined by local assessors to be the total taxable value of land and additions on the property. | Land | Improvement |
|---|---|---|---|---|
| 2024 | $3,617 | $145,416 | $12,000 | $133,416 |
| 2023 | $3,335 | $127,928 | $12,000 | $115,928 |
| 2022 | $3,506 | $134,492 | $12,000 | $122,492 |
| 2021 | $2,744 | $94,416 | $12,000 | $82,416 |
| 2020 | $2,583 | $86,968 | $12,000 | $74,968 |
| 2019 | $2,460 | $81,644 | $12,000 | $69,644 |
| 2018 | $2,426 | $80,532 | $14,000 | $66,532 |
| 2017 | $2,133 | $69,808 | $14,000 | $55,808 |
| 2016 | $1,960 | $64,812 | $14,000 | $50,812 |
| 2015 | $2,155 | $70,032 | $14,000 | $56,032 |
| 2014 | $1,824 | $57,784 | $14,000 | $43,784 |
| 2013 | -- | $49,560 | $16,000 | $33,560 |
Source: Public Records
Map
Nearby Homes
- 14 Hollow Springs Dr
- 16 Hollow Springs Ln
- 40 Hollow Springs Ln
- 23 Hollow Springs Dr
- 11 Hollow Springs Dr
- 45 Hollow Springs Dr
- 17 Hollow Springs Ln
- 43 Hollow Springs Ln
- 17 Hollow Springs Ln
- 17 Hollow Springs Ln
- 69 Hollow Springs Dr
- 1364 Mein Mitchell Rd
- 1401 Mein Mitchell Rd
- 116 Hollow Springs Dr
- 1261 Mein Mitchell Rd
- 45 Hollow Springs Ln
- 87 Hollow Springs Dr
- 1386 Mein Mitchell Rd
- 1278 Mein Mitchell Rd
- 97 Hollow Springs Dr