Estimated Value: $940,753 - $995,000
4
Beds
3
Baths
2,248
Sq Ft
$431/Sq Ft
Est. Value
About This Home
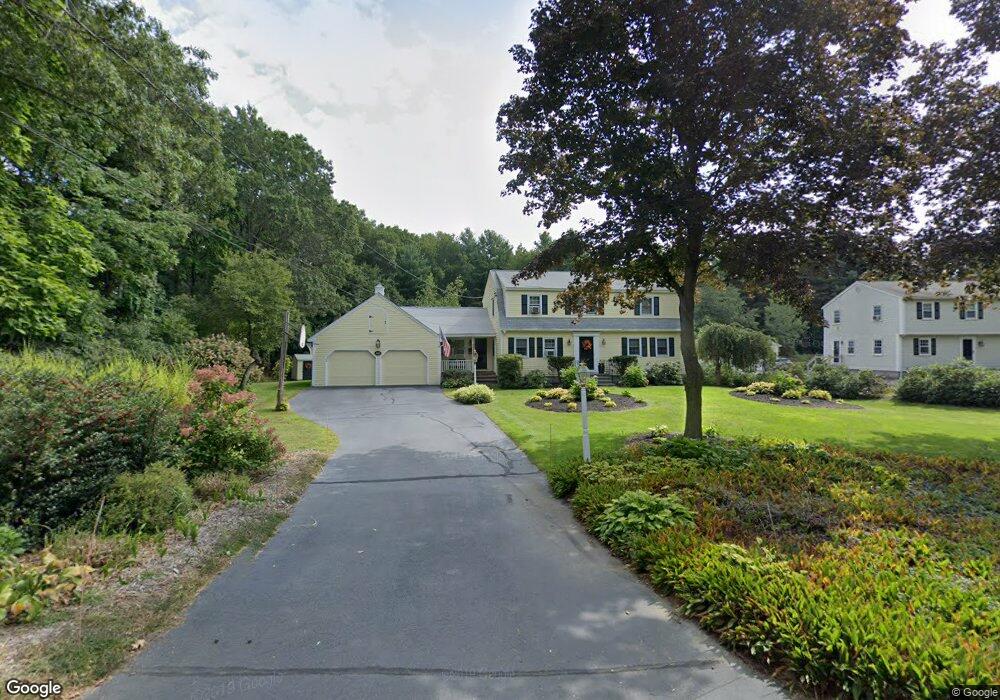
This home is located at 40 Hosmer St, Acton, MA 01720 and is currently estimated at $969,438, approximately $431 per square foot. 40 Hosmer St is a home located in Middlesex County with nearby schools including Acton-Boxborough Regional High School and Nashoba Brooks School.
Ownership History
Date
Name
Owned For
Owner Type
Purchase Details
Closed on
Nov 27, 1996
Sold by
Borkowski Daniel G and Borkowski Susan C
Bought by
Little Robert W and Little Kathleen C
Current Estimated Value
Home Financials for this Owner
Home Financials are based on the most recent Mortgage that was taken out on this home.
Original Mortgage
$180,000
Outstanding Balance
$18,495
Interest Rate
7.82%
Mortgage Type
Purchase Money Mortgage
Estimated Equity
$950,943
Create a Home Valuation Report for This Property
The Home Valuation Report is an in-depth analysis detailing your home's value as well as a comparison with similar homes in the area
Home Values in the Area
Average Home Value in this Area
Purchase History
| Date | Buyer | Sale Price | Title Company |
|---|---|---|---|
| Little Robert W | $228,000 | -- |
Source: Public Records
Mortgage History
| Date | Status | Borrower | Loan Amount |
|---|---|---|---|
| Open | Little Robert W | $180,000 | |
| Previous Owner | Little Robert W | $60,000 | |
| Previous Owner | Little Robert W | $100,000 |
Source: Public Records
Tax History Compared to Growth
Tax History
| Year | Tax Paid | Tax Assessment Tax Assessment Total Assessment is a certain percentage of the fair market value that is determined by local assessors to be the total taxable value of land and additions on the property. | Land | Improvement |
|---|---|---|---|---|
| 2025 | $14,219 | $829,100 | $339,200 | $489,900 |
| 2024 | $13,301 | $797,900 | $339,200 | $458,700 |
| 2023 | $12,966 | $738,400 | $308,500 | $429,900 |
| 2022 | $12,275 | $631,100 | $268,400 | $362,700 |
| 2021 | $12,172 | $601,700 | $248,100 | $353,600 |
| 2020 | $11,482 | $596,800 | $248,100 | $348,700 |
| 2019 | $10,971 | $566,400 | $248,100 | $318,300 |
| 2018 | $10,783 | $556,400 | $248,100 | $308,300 |
| 2017 | $10,756 | $564,300 | $248,100 | $316,200 |
| 2016 | $10,550 | $548,600 | $248,100 | $300,500 |
| 2015 | $10,338 | $542,700 | $248,100 | $294,600 |
| 2014 | $9,997 | $514,000 | $248,100 | $265,900 |
Source: Public Records
Map
Nearby Homes