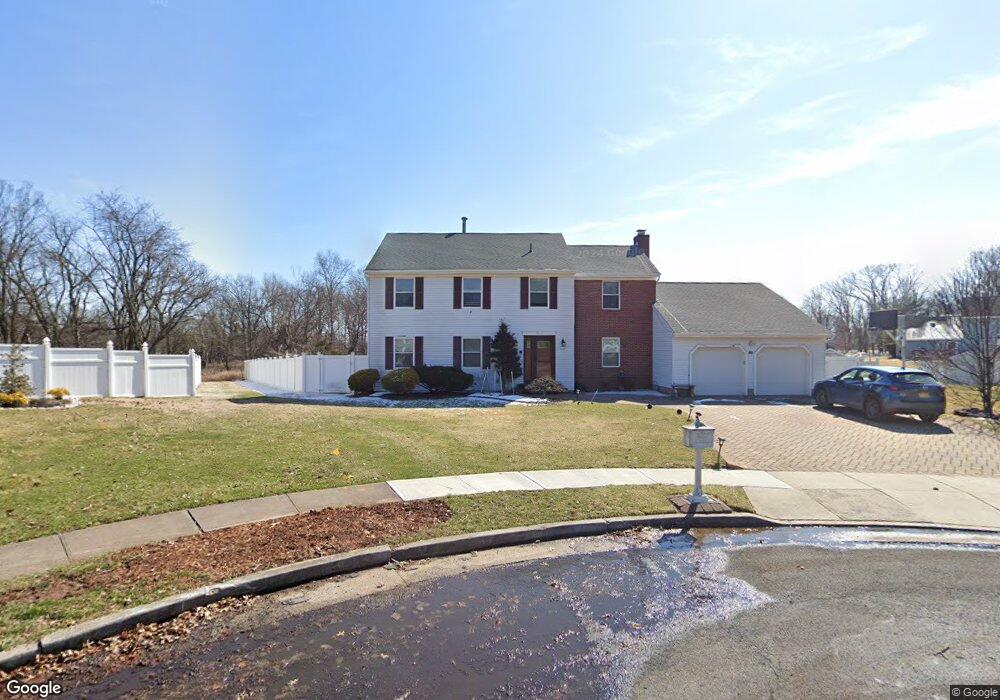
40 Independence Ct Piscataway, NJ 08854
Estimated Value: $817,123 - $892,000
--
Bed
--
Bath
2,568
Sq Ft
$333/Sq Ft
Est. Value
About This Home
This home is located at 40 Independence Ct, Piscataway, NJ 08854 and is currently estimated at $854,531, approximately $332 per square foot. 40 Independence Ct is a home located in Middlesex County with nearby schools including Randolphville Elementary School, Martin Luther King Intermediate School, and Quibbletown Middle School.
Ownership History
Date
Name
Owned For
Owner Type
Purchase Details
Closed on
Aug 27, 2003
Sold by
Nghiem Hung
Bought by
Bhatia Sameer and Martins Sonia
Current Estimated Value
Home Financials for this Owner
Home Financials are based on the most recent Mortgage that was taken out on this home.
Original Mortgage
$300,000
Outstanding Balance
$140,222
Interest Rate
6.35%
Estimated Equity
$714,309
Create a Home Valuation Report for This Property
The Home Valuation Report is an in-depth analysis detailing your home's value as well as a comparison with similar homes in the area
Home Values in the Area
Average Home Value in this Area
Purchase History
| Date | Buyer | Sale Price | Title Company |
|---|---|---|---|
| Bhatia Sameer | $378,000 | -- |
Source: Public Records
Mortgage History
| Date | Status | Borrower | Loan Amount |
|---|---|---|---|
| Open | Bhatia Sameer | $300,000 |
Source: Public Records
Tax History Compared to Growth
Tax History
| Year | Tax Paid | Tax Assessment Tax Assessment Total Assessment is a certain percentage of the fair market value that is determined by local assessors to be the total taxable value of land and additions on the property. | Land | Improvement |
|---|---|---|---|---|
| 2025 | $13,168 | $746,900 | $400,400 | $346,500 |
| 2024 | $12,895 | $673,200 | $258,300 | $414,900 |
| 2023 | $12,895 | $617,000 | $258,300 | $358,700 |
| 2022 | $12,459 | $555,700 | $258,300 | $297,400 |
| 2021 | $12,263 | $524,500 | $258,300 | $266,200 |
| 2020 | $11,993 | $514,300 | $258,300 | $256,000 |
| 2019 | $11,269 | $475,300 | $260,600 | $214,700 |
| 2018 | $11,376 | $480,800 | $260,600 | $220,200 |
| 2017 | $13,536 | $495,100 | $295,600 | $199,500 |
| 2016 | $13,288 | $495,100 | $295,600 | $199,500 |
| 2015 | $13,095 | $495,100 | $295,600 | $199,500 |
| 2014 | $12,774 | $495,100 | $295,600 | $199,500 |
Source: Public Records
Map
Nearby Homes
- 44 Independence Ct
- 36 Independence Ct
- 39 Independence Ct
- 35 Independence Ct
- 32 Independence Ct
- 39 Sturbridge Dr E
- 31 Independence Ct
- 28 Independence Ct
- 43 Sturbridge Dr E
- 35 Sturbridge Dr E
- 27 Independence Ct
- 24 Independence Ct
- 47 Sturbridge Dr E
- 31 Sturbridge Dr E
- 40 Sturbridge Dr E
- 23 Independence Ct
- 34 Sturbridge Dr E
- 27 Sturbridge Dr E
- 20 Independence Ct
- 30 Sturbridge Dr E