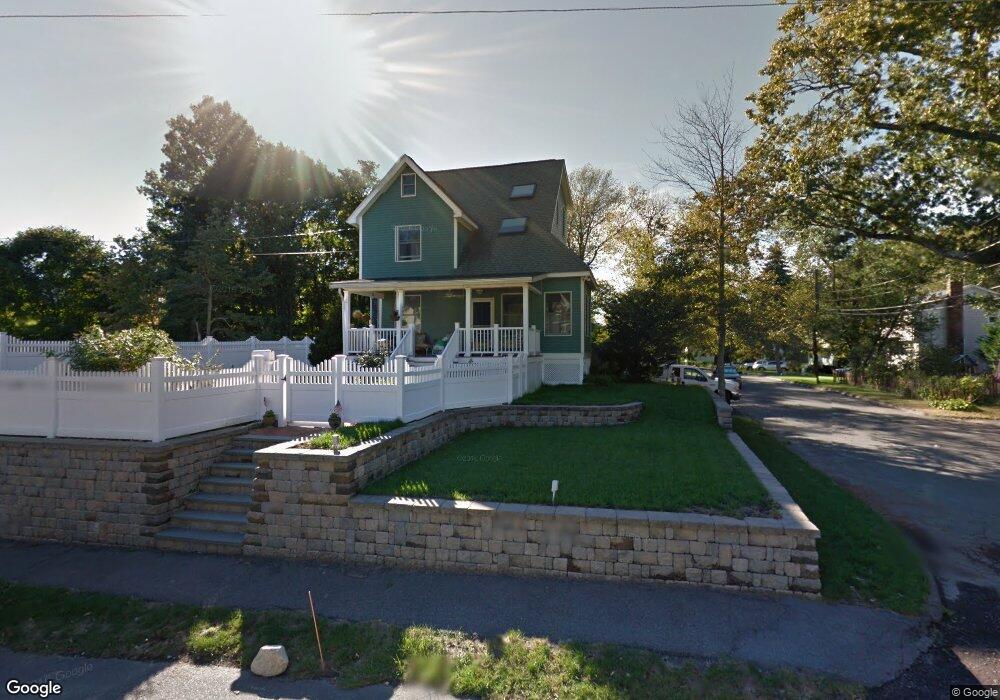
40 Isabella St Stoneham, MA 02180
Colonial Park NeighborhoodEstimated Value: $781,000 - $892,191
3
Beds
2
Baths
1,774
Sq Ft
$480/Sq Ft
Est. Value
About This Home
This home is located at 40 Isabella St, Stoneham, MA 02180 and is currently estimated at $851,048, approximately $479 per square foot. 40 Isabella St is a home located in Middlesex County with nearby schools including Stoneham High School, St. Patrick Elementary School, and Melrose Montessori School.
Ownership History
Date
Name
Owned For
Owner Type
Purchase Details
Closed on
Jul 8, 2025
Sold by
Cryan Daniel W and Cryan Suzanne T
Bought by
D W & Suzanne T Cryan Ret and Cryan
Current Estimated Value
Purchase Details
Closed on
Dec 10, 1997
Sold by
Goldberg Sheldon D
Bought by
Cryan Daniel W and Cryan Suzanne T
Home Financials for this Owner
Home Financials are based on the most recent Mortgage that was taken out on this home.
Original Mortgage
$169,100
Interest Rate
7.14%
Mortgage Type
Purchase Money Mortgage
Create a Home Valuation Report for This Property
The Home Valuation Report is an in-depth analysis detailing your home's value as well as a comparison with similar homes in the area
Home Values in the Area
Average Home Value in this Area
Purchase History
| Date | Buyer | Sale Price | Title Company |
|---|---|---|---|
| D W & Suzanne T Cryan Ret | -- | -- | |
| D W & Suzanne T Cryan Ret | -- | -- | |
| Cryan Daniel W | $178,000 | -- | |
| Cryan Daniel W | $178,000 | -- |
Source: Public Records
Mortgage History
| Date | Status | Borrower | Loan Amount |
|---|---|---|---|
| Previous Owner | Cryan Daniel W | $174,000 | |
| Previous Owner | Cryan Daniel W | $169,100 |
Source: Public Records
Tax History Compared to Growth
Tax History
| Year | Tax Paid | Tax Assessment Tax Assessment Total Assessment is a certain percentage of the fair market value that is determined by local assessors to be the total taxable value of land and additions on the property. | Land | Improvement |
|---|---|---|---|---|
| 2025 | $7,802 | $762,700 | $421,300 | $341,400 |
| 2024 | $7,607 | $718,300 | $401,300 | $317,000 |
| 2023 | $7,338 | $661,100 | $361,300 | $299,800 |
| 2022 | $6,344 | $609,400 | $331,300 | $278,100 |
| 2021 | $6,331 | $585,100 | $311,300 | $273,800 |
| 2020 | $6,247 | $579,000 | $311,300 | $267,700 |
| 2019 | $6,016 | $536,200 | $281,300 | $254,900 |
| 2018 | $5,751 | $491,100 | $251,300 | $239,800 |
| 2017 | $5,998 | $484,100 | $251,300 | $232,800 |
| 2016 | $5,771 | $454,400 | $241,300 | $213,100 |
| 2015 | $5,749 | $443,600 | $241,300 | $202,300 |
| 2014 | $5,289 | $392,100 | $201,300 | $190,800 |
Source: Public Records
Map
Nearby Homes
- 14 Dinanno Rd
- 39 Tamarock Terrace
- 5 Sheffield Rd
- 159 Franklin St Unit C2
- 81 Spring St
- 1 Ludlow Ave
- 6 Gavin Cir
- 17 Franklin St
- 4 Gavin Cir
- 137 Franklin St Unit 102
- 137 Franklin St Unit 404
- 6 Lovis Ave
- 9 Lovis Ave
- 569 Franklin St Unit 1
- 569 Franklin St Unit 3
- 2 Overlook Rd
- 119 W Highland Ave Unit 1
- 61 Forest St
- 126 Ashland St
- 24 Ellsworth Ave